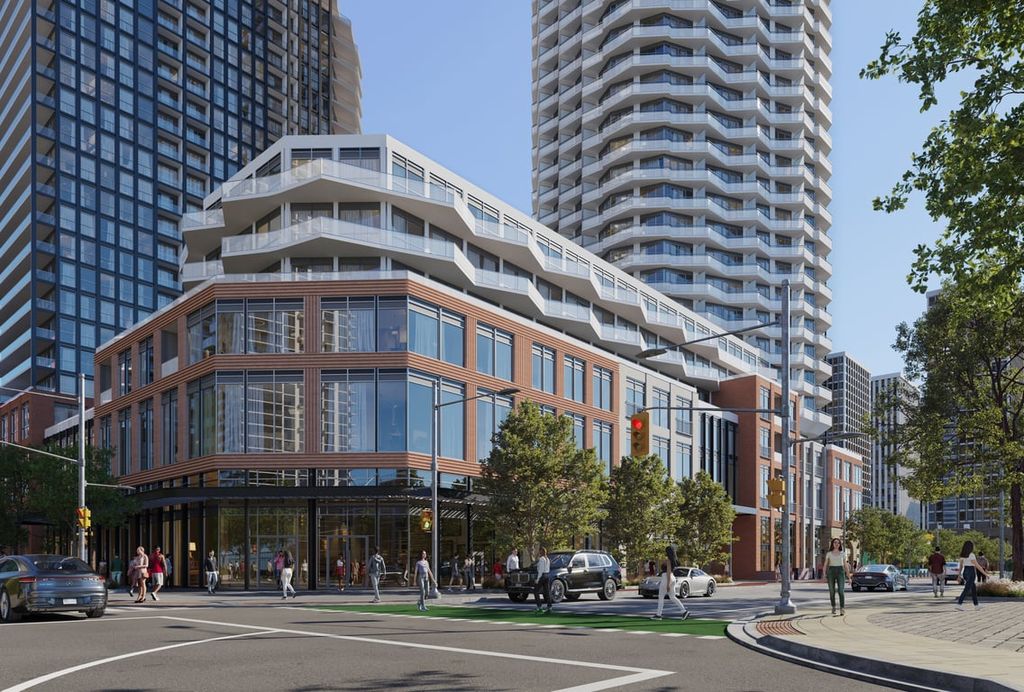
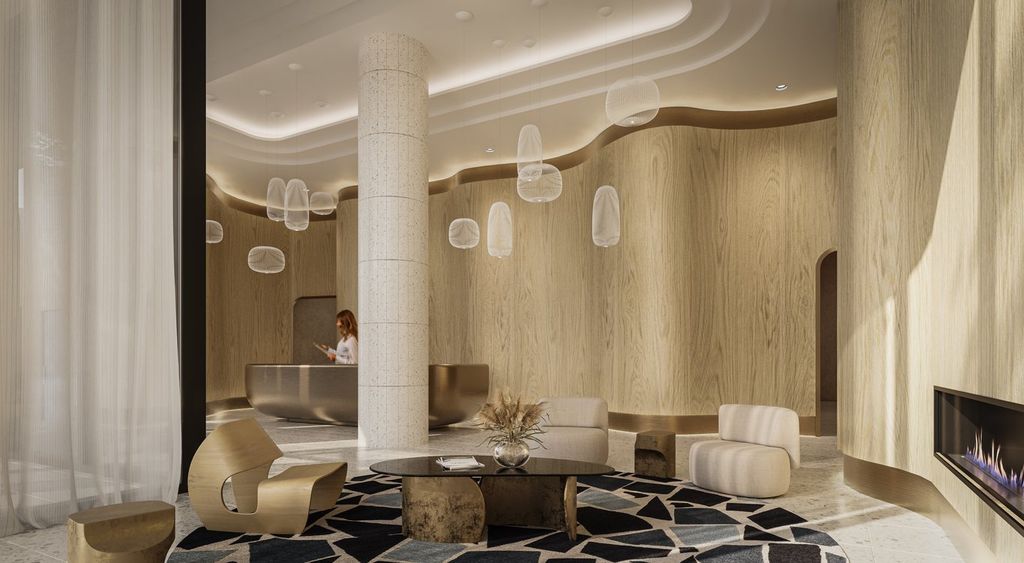
Bravo Condos
- valencia_698_encore
1 Commerce St
Vaughan ON, L4K 5C3
2 Beds
2 Baths
698 sqft
Vaughan ON, L4K 5C3
Mortgage | |
---|---|
Purchase Price | $ |
Down Payment % | $166,398 |
Mortgage Amount | $665,592 |
Mortgage Payment % | $3,453 |
Income | |
---|---|
Gross Rental Income | $ |
Vacancy Rate % | $ |
Other | $ |
Gross Operating Income | $1,701 |
Operating Expenses | |
Management Fees % | $ |
Property Tax | $ |
Repair Reserve % | $ |
Insurance | $ |
Condo/Strata Fees | $ |
Total Operating Expenses | $874 |
Net Operating Income | $826 |
Debt Service | |
Mortgage Payment | $3,453 |
Net Cash Flow | -$2,626 |
Year 1 | Year 2 | Year 3 | Year 4 | Year 5 | Year 6 | Year 7 | Year 8 | Year 9 | Year 10 | |
---|---|---|---|---|---|---|---|---|---|---|
Investments | ||||||||||
Deposits | $83,197 | $20,799 | $20,799 | $41,599 | - | - | - | - | - | - |
Closing Costs | - | - | - | - | $29,618 | - | - | - | - | - |
Mortgage Paydown | - | - | - | - | $9,474 | $10,811 | $11,330 | $11,875 | $12,446 | $13,044 |
Total | $83,197 | $20,799 | $20,799 | $41,599 | $39,092 | $10,811 | $11,330 | $11,875 | $12,446 | $13,044 |
Cash Invested | $83,197 | $103,996 | $124,795 | $166,394 | $205,486 | $216,297 | $227,628 | $239,503 | $251,950 | $264,994 |
Rental Cash Flows | ||||||||||
Rent and other income | - | - | - | - | $18,715 | $21,221 | $22,133 | $23,085 | $24,078 | $25,113 |
Operating Expenses | - | - | - | - | -$9,620 | -$10,727 | -$10,986 | -$11,253 | -$11,527 | -$11,809 |
Mortgage Payment | - | - | - | - | -$37,988 | -$41,441 | -$41,441 | -$41,441 | -$41,441 | -$41,441 |
Net Cash Flow | - | - | - | - | -$28,893 | -$30,947 | -$30,294 | -$29,609 | -$28,891 | -$28,137 |
Returns | ||||||||||
Property Price Appreciation | $41,599 | $43,679 | $45,863 | $48,156 | $50,564 | $53,092 | $55,747 | $58,534 | $61,461 | $64,534 |
Mortgage Paydown | - | - | - | - | $9,474 | $10,811 | $11,330 | $11,875 | $12,446 | $13,044 |
Net Cash Flow | - | - | - | - | -$28,893 | -$30,947 | -$30,294 | -$29,609 | -$28,891 | -$28,137 |
Total Return | $41,599 | $43,679 | $45,863 | $48,156 | $31,145 | $32,956 | $36,783 | $40,800 | $45,016 | $49,441 |
Cumulative Return | $41,599 | $85,278 | $131,142 | $179,299 | $210,444 | $243,400 | $280,183 | $320,984 | $366,000 | $415,441 |
Investment Metrics | ||||||||||
Cumulative ROI | 50.0% | 82.0% | 105.1% | 107.8% | 102.4% | 112.5% | 123.1% | 134.0% | 145.3% | 156.8% |
Cash On Cash | - | - | - | - | -14.1% | -14.3% | -13.3% | -12.4% | -11.5% | -10.6% |