

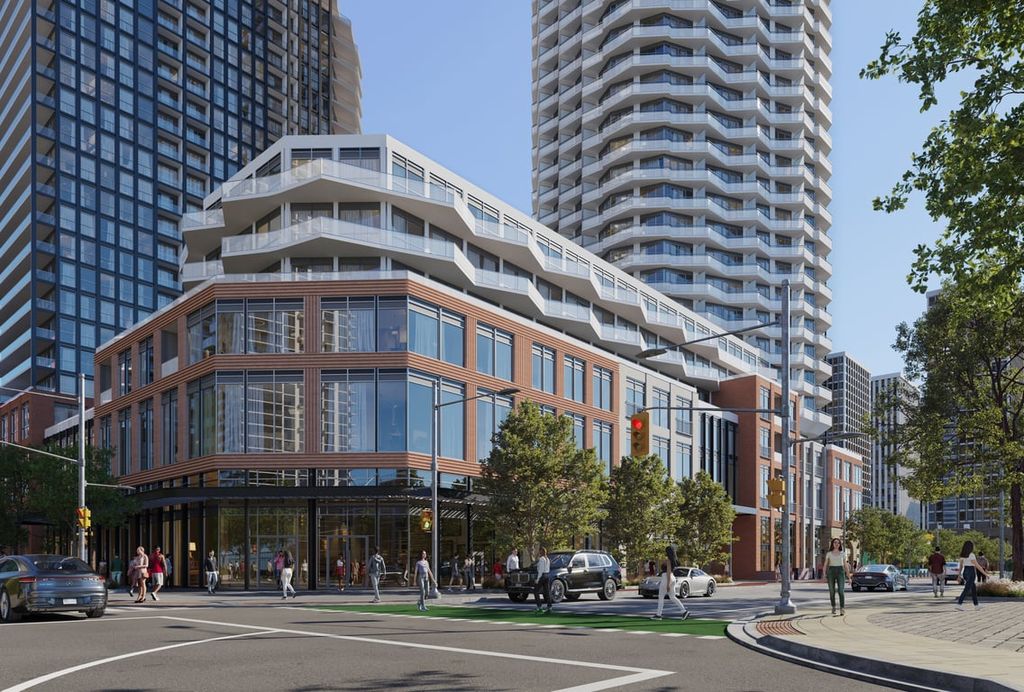


valencia_642_encore-1 Commerce St, Vaughan, ON, L4K 5C3
Vaughan ON, L4K 5C3
MLS® # PB1063-VALENCIA_642_ENCO


2 Beds
1 Bath
643 sqft
Vaughan ON, L4K 5C3
| Mortgage | |
|---|---|
| Purchase Price | $ |
| Down Payment % | $164,718 |
| Mortgage Amount | $658,872 |
| Mortgage Payment % | $3,418 |
| Income | |
|---|---|
| Gross Rental Income | $ |
| Vacancy Rate % | $ |
| Other | $ |
| Gross Operating Income | $1,567 |
| Operating Expenses | |
| Management Fees % | $ |
| Property Tax | $ |
| Repair Reserve % | $ |
| Insurance | $ |
| Condo/Strata Fees | $ |
| Total Operating Expenses | $819 |
| Net Operating Income | $748 |
| Debt Service | |
| Mortgage Payment | $3,418 |
| Net Cash Flow | -$2,670 |
| Year 1 | Year 2 | Year 3 | Year 4 | Year 5 | Year 6 | Year 7 | Year 8 | Year 9 | Year 10 | |
|---|---|---|---|---|---|---|---|---|---|---|
| Investments | ||||||||||
| Deposits | $82,357 | $20,589 | $20,589 | $41,179 | - | - | - | - | - | - |
| Closing Costs | - | - | - | - | $29,450 | - | - | - | - | - |
| Mortgage Paydown | - | - | - | - | $9,378 | $10,702 | $11,216 | $11,755 | $12,320 | $12,912 |
| Total | $82,357 | $20,589 | $20,589 | $41,179 | $38,828 | $10,702 | $11,216 | $11,755 | $12,320 | $12,912 |
| Cash Invested | $82,357 | $102,946 | $123,535 | $164,714 | $203,542 | $214,244 | $225,461 | $237,216 | $249,537 | $262,450 |
| Rental Cash Flows | ||||||||||
| Rent and other income | - | - | - | - | $17,240 | $19,549 | $20,389 | $21,266 | $22,180 | $23,134 |
| Operating Expenses | - | - | - | - | -$9,009 | -$10,045 | -$10,287 | -$10,537 | -$10,792 | -$11,055 |
| Mortgage Payment | - | - | - | - | -$37,604 | -$41,023 | -$41,023 | -$41,023 | -$41,023 | -$41,023 |
| Net Cash Flow | - | - | - | - | -$29,373 | -$31,519 | -$30,921 | -$30,293 | -$29,635 | -$28,944 |
| Returns | ||||||||||
| Property Price Appreciation | $41,179 | $43,238 | $45,400 | $47,670 | $50,053 | $52,556 | $55,184 | $57,943 | $60,840 | $63,882 |
| Mortgage Paydown | - | - | - | - | $9,378 | $10,702 | $11,216 | $11,755 | $12,320 | $12,912 |
| Net Cash Flow | - | - | - | - | -$29,373 | -$31,519 | -$30,921 | -$30,293 | -$29,635 | -$28,944 |
| Total Return | $41,179 | $43,238 | $45,400 | $47,670 | $30,058 | $31,738 | $35,479 | $39,405 | $43,526 | $47,851 |
| Cumulative Return | $41,179 | $84,417 | $129,818 | $177,488 | $207,547 | $239,286 | $274,765 | $314,170 | $357,697 | $405,548 |
| Investment Metrics | ||||||||||
| Cumulative ROI | 50.0% | 82.0% | 105.1% | 107.8% | 102.0% | 111.7% | 121.9% | 132.4% | 143.3% | 154.5% |
| Cash On Cash | - | - | - | - | -14.4% | -14.7% | -13.7% | -12.8% | -11.9% | -11.0% |
-8.03%
Price change (1 year)
49.6%
Price change (5 years)
-8.03%
Price change (1 year)
49.6%
Price change (5 years)
