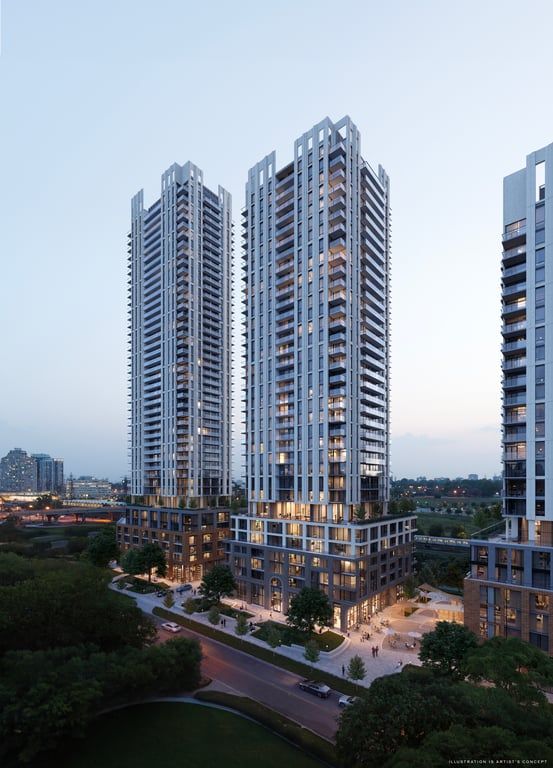
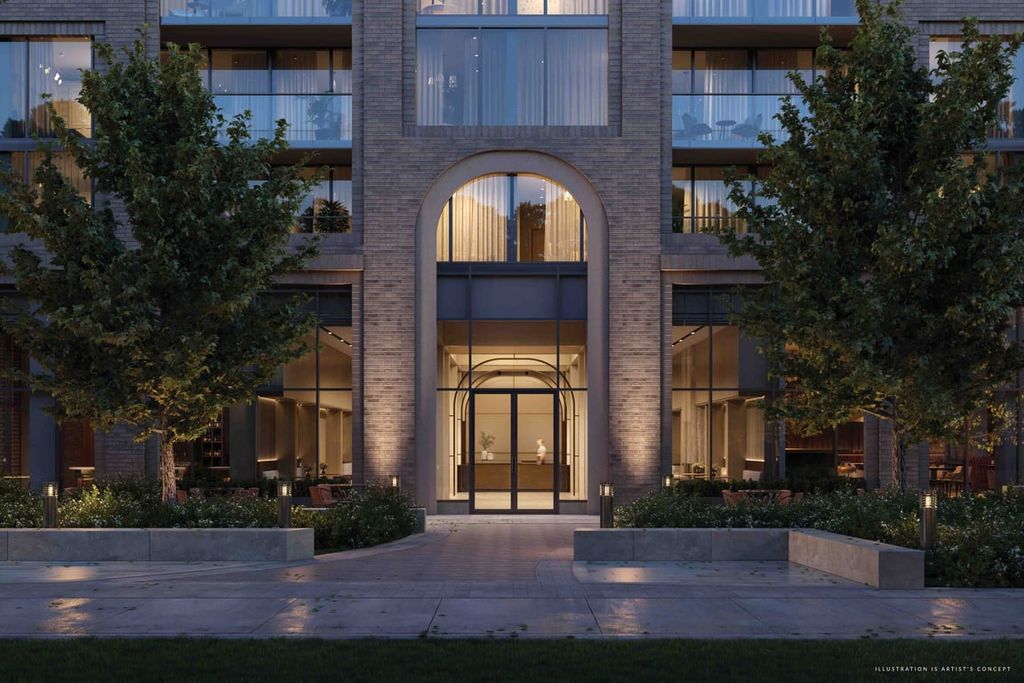
Arcadia District Condos
- c1611_lorahill_tower
56 Fieldway Rd
Toronto ON, M8Z 3L2
2.0 Beds
2 Baths
707 sqft
Toronto ON, M8Z 3L2
Mortgage | |
---|---|
Purchase Price | $ |
Down Payment % | $169,797 |
Mortgage Amount | $679,193 |
Mortgage Payment % | $3,524 |
Income | |
---|---|
Gross Rental Income | $ |
Vacancy Rate % | $ |
Other | $ |
Gross Operating Income | $1,714 |
Operating Expenses | |
Management Fees % | $ |
Property Tax | $ |
Repair Reserve % | $ |
Insurance | $ |
Condo/Strata Fees | $ |
Total Operating Expenses | $858 |
Net Operating Income | $855 |
Debt Service | |
Mortgage Payment | $3,524 |
Net Cash Flow | -$2,668 |
Year 1 | Year 2 | Year 3 | Year 4 | Year 5 | Year 6 | Year 7 | Year 8 | Year 9 | Year 10 | |
---|---|---|---|---|---|---|---|---|---|---|
Investments | ||||||||||
Deposits | $84,898 | - | $84,899 | - | - | - | - | - | - | - |
Closing Costs | - | - | $43,409 | - | - | - | - | - | - | - |
Mortgage Paydown | - | - | $8,771 | $10,989 | $11,517 | $12,070 | $12,651 | $13,259 | $13,896 | $14,564 |
Total | $84,898 | $0 | $137,079 | $10,989 | $11,517 | $12,070 | $12,651 | $13,259 | $13,896 | $14,564 |
Cash Invested | $84,898 | $84,898 | $221,977 | $232,966 | $244,484 | $256,554 | $269,205 | $282,464 | $296,361 | $310,925 |
Rental Cash Flows | ||||||||||
Rent and other income | - | - | $17,144 | $21,310 | $22,227 | $23,183 | $24,179 | $25,219 | $26,304 | $27,435 |
Operating Expenses | - | - | -$8,589 | -$10,515 | -$10,771 | -$11,033 | -$11,304 | -$11,581 | -$11,867 | -$12,160 |
Mortgage Payment | - | - | -$35,240 | -$42,288 | -$42,288 | -$42,288 | -$42,288 | -$42,288 | -$42,288 | -$42,288 |
Net Cash Flow | - | - | -$26,684 | -$31,492 | -$30,832 | -$30,139 | -$29,412 | -$28,650 | -$27,851 | -$27,014 |
Returns | ||||||||||
Property Price Appreciation | $42,449 | $44,571 | $46,800 | $49,140 | $51,597 | $54,177 | $56,886 | $59,730 | $62,717 | $65,853 |
Mortgage Paydown | - | - | $8,771 | $10,989 | $11,517 | $12,070 | $12,651 | $13,259 | $13,896 | $14,564 |
Net Cash Flow | - | - | -$26,684 | -$31,492 | -$30,832 | -$30,139 | -$29,412 | -$28,650 | -$27,851 | -$27,014 |
Total Return | $42,449 | $44,571 | $28,887 | $28,636 | $32,282 | $36,108 | $40,124 | $44,339 | $48,761 | $53,403 |
Cumulative Return | $42,449 | $87,021 | $115,908 | $144,545 | $176,828 | $212,937 | $253,061 | $297,401 | $346,163 | $399,566 |
Investment Metrics | ||||||||||
Cumulative ROI | 50.0% | 102.5% | 52.2% | 62.0% | 72.3% | 83.0% | 94.0% | 105.3% | 116.8% | 128.5% |
Cash On Cash | - | - | -12.0% | -13.5% | -12.6% | -11.7% | -10.9% | -10.1% | -9.4% | -8.7% |