


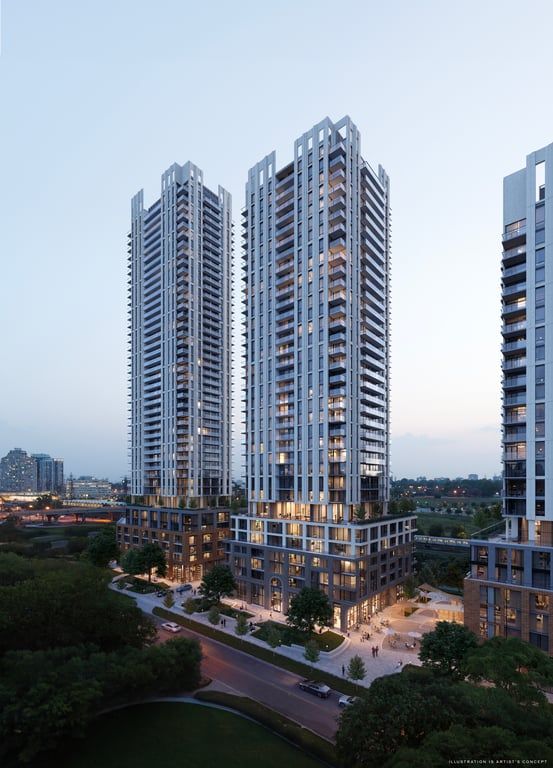
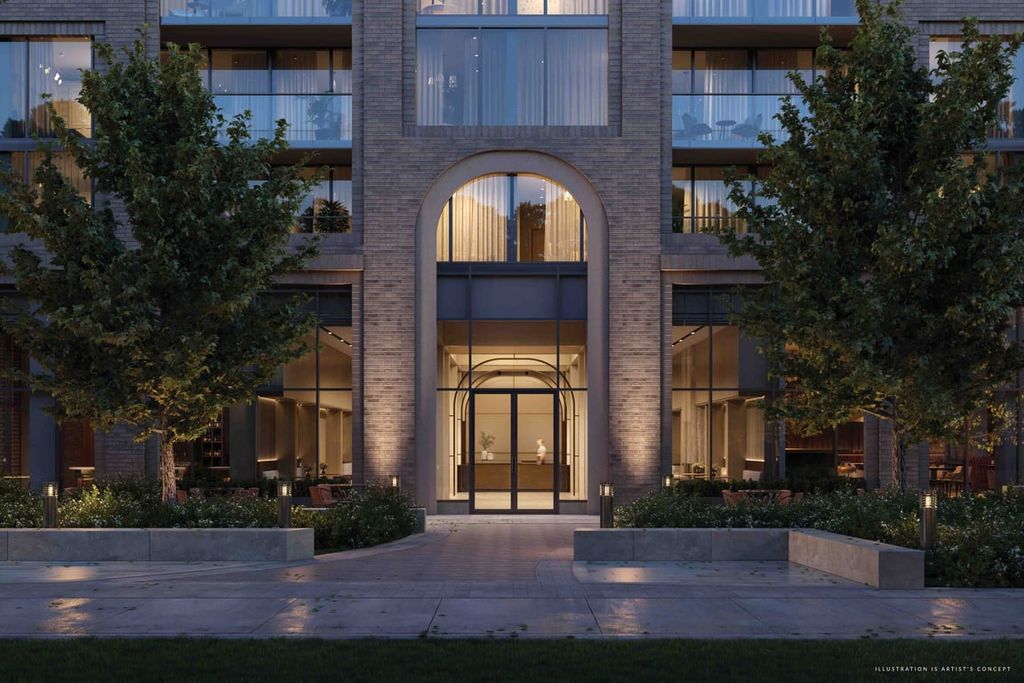


c1602_kenway_tower-56 Fieldway Rd, Toronto, ON, M8Z 3L2
Toronto ON, M8Z 3L2
MLS® # PB1126-C1602_KENWAY_TOWE


2 Beds
2 Baths
694 sqft
Toronto ON, M8Z 3L2
| Mortgage | |
|---|---|
| Purchase Price | $ |
| Down Payment % | $168,797 |
| Mortgage Amount | $675,193 |
| Mortgage Payment % | $3,503 |
| Income | |
|---|---|
Gross Rental Income | $ |
| Vacancy Rate % | $ |
| Other | $ |
| Gross Operating Income | $1,682 |
| Operating Expenses | |
| Management Fees % | $ |
| Property Tax | $ |
| Repair Reserve % | $ |
| Insurance | $ |
| Condo/Strata Fees | $ |
| Total Operating Expenses | $846 |
| Net Operating Income | $836 |
| Debt Service | |
| Mortgage Payment | $3,503 |
| Net Cash Flow | -$2,666 |
| Year 1 | Year 2 | Year 3 | Year 4 | Year 5 | Year 6 | Year 7 | Year 8 | Year 9 | Year 10 | |
|---|---|---|---|---|---|---|---|---|---|---|
| Investments | ||||||||||
| Deposits | $84,398 | $84,399 | - | - | - | - | - | - | - | - |
| Closing Costs | - | - | $43,209 | - | - | - | - | - | - | - |
| Mortgage Paydown | - | - | $10,505 | $11,010 | $11,539 | $12,094 | $12,675 | $13,284 | $13,923 | $14,592 |
| Total | $84,398 | $84,399 | $53,714 | $11,010 | $11,539 | $12,094 | $12,675 | $13,284 | $13,923 | $14,592 |
| Cash Invested | $84,398 | $168,797 | $222,511 | $233,521 | $245,060 | $257,154 | $269,830 | $283,114 | $297,037 | $311,629 |
| Rental Cash Flows | ||||||||||
| Rent and other income | - | - | $20,195 | $21,063 | $21,969 | $22,914 | $23,899 | $24,927 | $25,999 | $27,117 |
| Operating Expenses | - | - | -$10,152 | -$10,398 | -$10,651 | -$10,911 | -$11,178 | -$11,452 | -$11,735 | -$12,025 |
| Mortgage Payment | - | - | -$42,039 | -$42,039 | -$42,039 | -$42,039 | -$42,039 | -$42,039 | -$42,039 | -$42,039 |
| Net Cash Flow | - | - | -$31,996 | -$31,373 | -$30,721 | -$30,036 | -$29,318 | -$28,565 | -$27,775 | -$26,947 |
| Returns | ||||||||||
| Property Price Appreciation | $42,199 | $44,309 | $46,524 | $48,851 | $51,293 | $53,858 | $56,551 | $59,378 | $62,347 | $65,465 |
| Mortgage Paydown | - | - | $10,505 | $11,010 | $11,539 | $12,094 | $12,675 | $13,284 | $13,923 | $14,592 |
| Net Cash Flow | - | - | -$31,996 | -$31,373 | -$30,721 | -$30,036 | -$29,318 | -$28,565 | -$27,775 | -$26,947 |
| Total Return | $42,199 | $44,309 | $25,034 | $28,487 | $32,112 | $35,916 | $39,908 | $44,098 | $48,495 | $53,109 |
| Cumulative Return | $42,199 | $86,508 | $111,542 | $140,030 | $172,142 | $208,058 | $247,967 | $292,065 | $340,561 | $393,670 |
| Investment Metrics | ||||||||||
| Cumulative ROI | 50.0% | 51.3% | 50.1% | 60.0% | 70.2% | 80.9% | 91.9% | 103.2% | 114.7% | 126.3% |
| Cash On Cash | - | - | -14.4% | -13.4% | -12.5% | -11.7% | -10.9% | -10.1% | -9.4% | -8.6% |
-5.14%
Price change (1 year)
6.56%
Price change (5 years)
10.77%
Price change (1 year)
38.64%
Price change (5 years)
