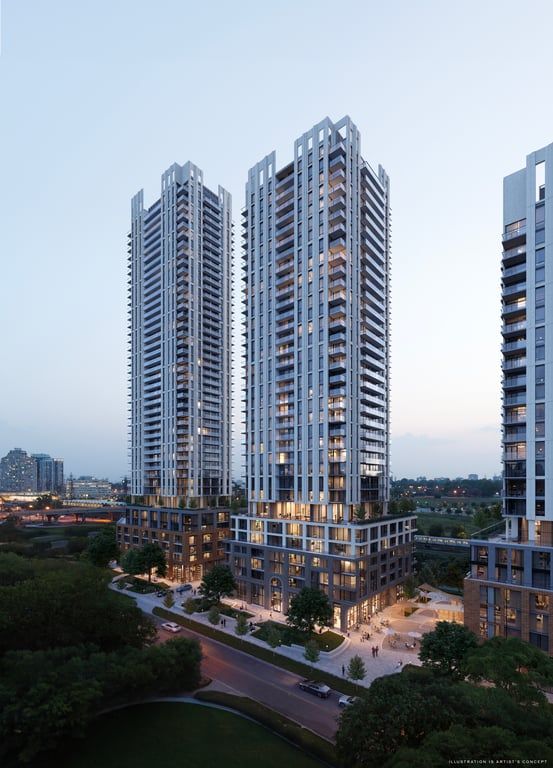
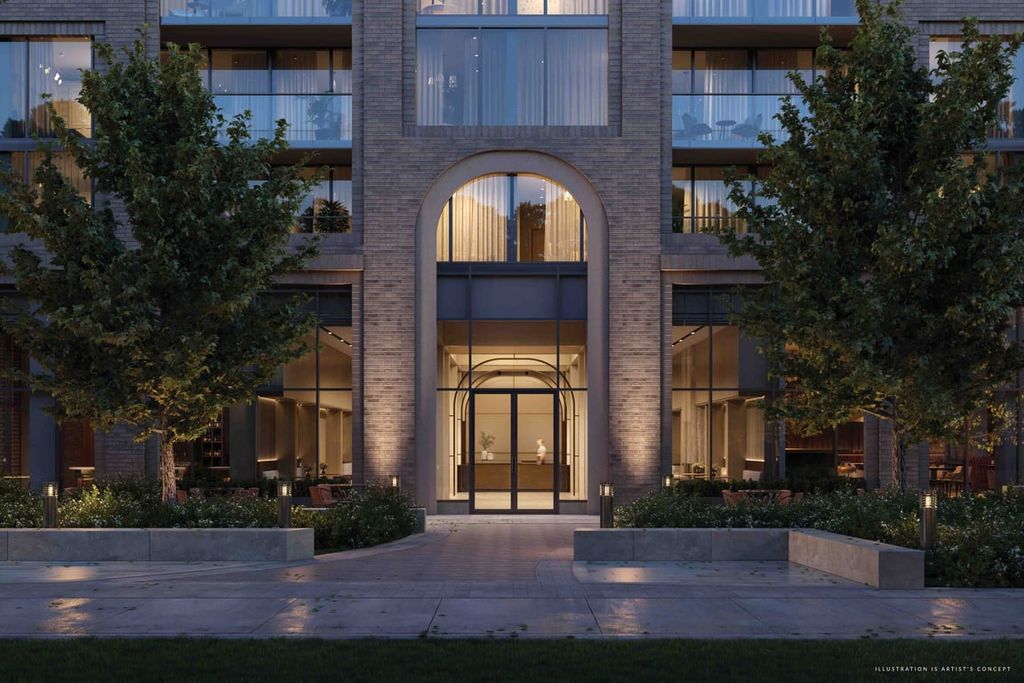
Arcadia District Condos - 56 Fieldway Rd - c1305_kipling_tower - Toronto, ON, M8Z 3L2
2.0 Beds
2 Baths
789 sqft
2.0 Beds
2 Baths
789 sqft
MULTIMEDIA
Mortgage | |
---|---|
Purchase Price | $ |
Down Payment % | $181,197 |
Mortgage Amount | $724,793 |
Mortgage Payment % | $3,760 |
Income | |
---|---|
Gross Rental Income | $ |
Vacancy Rate % | $ |
Other | $ |
Gross Operating Income | $1,913 |
Operating Expenses | |
Management Fees % | $ |
Property Tax | $ |
Repair Reserve % | $ |
Insurance | $ |
Condo/Strata Fees | $ |
Total Operating Expenses | $947 |
Net Operating Income | $965 |
Debt Service | |
Mortgage Payment | $3,760 |
Net Cash Flow | -$2,795 |
Year 1 | Year 2 | Year 3 | Year 4 | Year 5 | Year 6 | Year 7 | Year 8 | Year 9 | Year 10 | |
---|---|---|---|---|---|---|---|---|---|---|
Investments | ||||||||||
Deposits | $90,598 | - | $90,599 | - | - | - | - | - | - | - |
Closing Costs | - | - | $45,689 | - | - | - | - | - | - | - |
Mortgage Paydown | - | - | $9,360 | $11,726 | $12,290 | $12,881 | $13,500 | $14,149 | $14,829 | $15,542 |
Total | $90,598 | $0 | $145,648 | $11,726 | $12,290 | $12,881 | $13,500 | $14,149 | $14,829 | $15,542 |
Cash Invested | $90,598 | $90,598 | $236,246 | $247,973 | $260,263 | $273,145 | $286,645 | $300,794 | $315,624 | $331,166 |
Rental Cash Flows | ||||||||||
Rent and other income | - | - | $19,133 | $23,782 | $24,805 | $25,871 | $26,984 | $28,144 | $29,354 | $30,617 |
Operating Expenses | - | - | -$9,479 | -$11,605 | -$11,888 | -$12,179 | -$12,478 | -$12,785 | -$13,100 | -$13,425 |
Mortgage Payment | - | - | -$37,606 | -$45,127 | -$45,127 | -$45,127 | -$45,127 | -$45,127 | -$45,127 | -$45,127 |
Net Cash Flow | - | - | -$27,952 | -$32,950 | -$32,211 | -$31,435 | -$30,621 | -$29,768 | -$28,873 | -$27,936 |
Returns | ||||||||||
Property Price Appreciation | $45,299 | $47,564 | $49,942 | $52,439 | $55,061 | $57,814 | $60,705 | $63,740 | $66,927 | $70,274 |
Mortgage Paydown | - | - | $9,360 | $11,726 | $12,290 | $12,881 | $13,500 | $14,149 | $14,829 | $15,542 |
Net Cash Flow | - | - | -$27,952 | -$32,950 | -$32,211 | -$31,435 | -$30,621 | -$29,768 | -$28,873 | -$27,936 |
Total Return | $45,299 | $47,564 | $31,350 | $31,215 | $35,141 | $39,261 | $43,584 | $48,122 | $52,883 | $57,880 |
Cumulative Return | $45,299 | $92,863 | $124,214 | $155,430 | $190,571 | $229,832 | $273,417 | $321,539 | $374,423 | $432,303 |
Investment Metrics | ||||||||||
Cumulative ROI | 50.0% | 102.5% | 52.6% | 62.7% | 73.2% | 84.1% | 95.4% | 106.9% | 118.6% | 130.5% |
Cash On Cash | - | - | -11.8% | -13.3% | -12.4% | -11.5% | -10.7% | -9.9% | -9.1% | -8.4% |
12.33%
Price change (1 year)
44.79%
Price change (5 years)