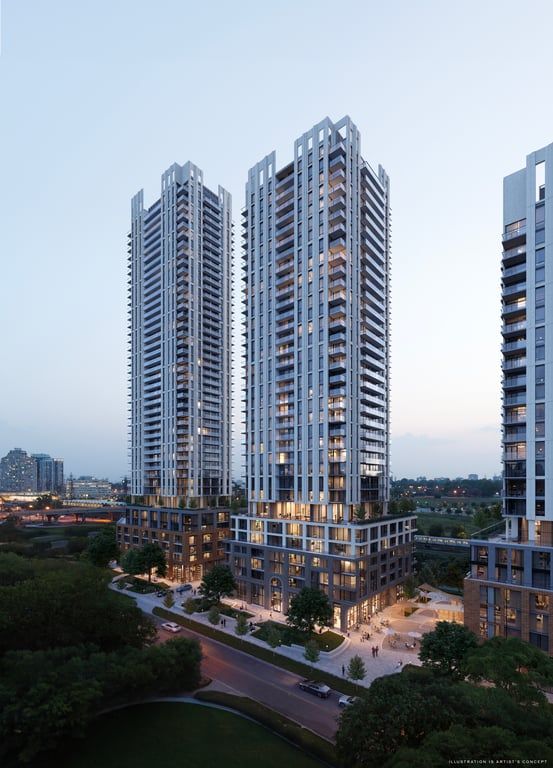
c1201_alterton_tower-56 Fieldway Rd, Toronto, ON, M8Z 3L2
Toronto ON, M8Z 3L2
Potential Investment Performance
Cumulative ROI
Cumulative Market Appreciation
Net Operating Income in Year 5
Cash on Cash Return in Year 5
Assumptions
Mortgage Calculator
| Mortgage | |
|---|---|
| Purchase Price | $ |
| Down Payment % | $135,597 |
| Mortgage Amount | $542,393 |
| Mortgage Payment % | $2,814 |
Cash Flow Calculator
| Income | |
|---|---|
Gross Rental Income | $ |
| Vacancy Rate % | $ |
| Other | $ |
| Gross Operating Income | $1,516 |
| Operating Expenses | |
| Management Fees % | $ |
| Property Tax | $ |
| Repair Reserve % | $ |
| Insurance | $ |
| Condo/Strata Fees | $ |
| Total Operating Expenses | $669 |
| Net Operating Income | $846 |
| Debt Service | |
| Mortgage Payment | $2,814 |
| Net Cash Flow | -$1,967 |
Acquistion Costs
Deposit Schedule
Components of Return
Potential Returns
| Year 1 | Year 2 | Year 3 | Year 4 | Year 5 | Year 6 | Year 7 | Year 8 | Year 9 | Year 10 | |
|---|---|---|---|---|---|---|---|---|---|---|
| Investments | ||||||||||
| Deposits | $67,798 | $67,799 | - | - | - | - | - | - | - | - |
| Closing Costs | - | $36,569 | - | - | - | - | - | - | - | - |
| Mortgage Paydown | - | $2,072 | $8,538 | $8,949 | $9,379 | $9,830 | $10,302 | $10,797 | $11,316 | $11,860 |
| Total | $67,798 | $106,440 | $8,538 | $8,949 | $9,379 | $9,830 | $10,302 | $10,797 | $11,316 | $11,860 |
| Cash Invested | $67,798 | $174,238 | $182,777 | $191,726 | $201,105 | $210,935 | $221,238 | $232,035 | $243,352 | $255,213 |
| Rental Cash Flows | ||||||||||
| Rent and other income | - | $4,548 | $18,388 | $19,179 | $20,004 | $20,864 | $21,761 | $22,697 | $23,673 | $24,691 |
| Operating Expenses | - | -$2,007 | -$8,079 | -$8,280 | -$8,487 | -$8,699 | -$8,918 | -$9,142 | -$9,374 | -$9,612 |
| Mortgage Payment | - | -$8,442 | -$33,771 | -$33,771 | -$33,771 | -$33,771 | -$33,771 | -$33,771 | -$33,771 | -$33,771 |
| Net Cash Flow | - | -$5,901 | -$23,461 | -$22,871 | -$22,253 | -$21,606 | -$20,927 | -$20,216 | -$19,471 | -$18,691 |
| Returns | ||||||||||
| Property Price Appreciation | $33,899 | $35,594 | $37,374 | $39,242 | $41,205 | $43,265 | $45,428 | $47,700 | $50,085 | $52,589 |
| Mortgage Paydown | - | $2,072 | $8,538 | $8,949 | $9,379 | $9,830 | $10,302 | $10,797 | $11,316 | $11,860 |
| Net Cash Flow | - | -$5,901 | -$23,461 | -$22,871 | -$22,253 | -$21,606 | -$20,927 | -$20,216 | -$19,471 | -$18,691 |
| Total Return | $33,899 | $31,765 | $22,451 | $25,319 | $28,330 | $31,489 | $34,803 | $38,281 | $41,929 | $45,757 |
| Cumulative Return | $33,899 | $65,664 | $88,115 | $113,435 | $141,766 | $173,255 | $208,059 | $246,340 | $288,270 | $334,028 |
| Investment Metrics | ||||||||||
| Cumulative ROI | 50.0% | 37.7% | 48.2% | 59.2% | 70.5% | 82.1% | 94.0% | 106.2% | 118.5% | 130.9% |
| Cash On Cash | - | -3.4% | -12.8% | -11.9% | -11.1% | -10.2% | -9.5% | -8.7% | -8.0% | -7.3% |
Market Price Trends
Condominium
-6.2%
Price change (1 year)
6.29%
Price change (5 years)
All Properties
5.64%
Price change (1 year)
30.64%
Price change (5 years)


