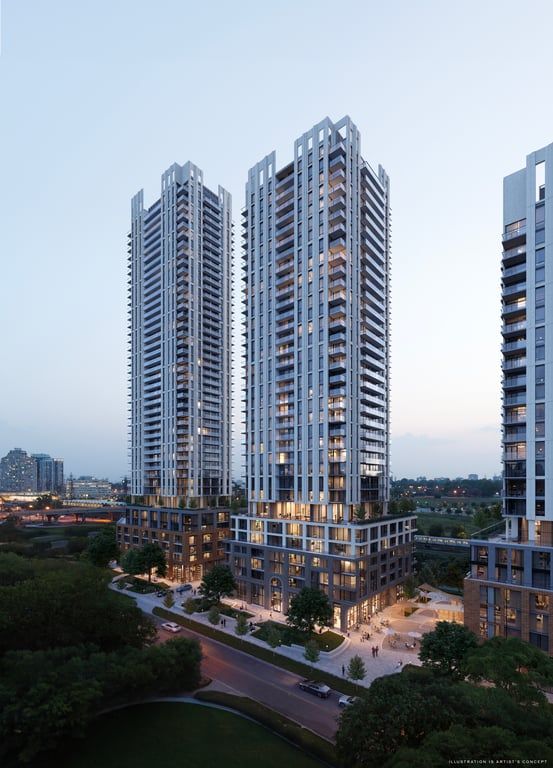
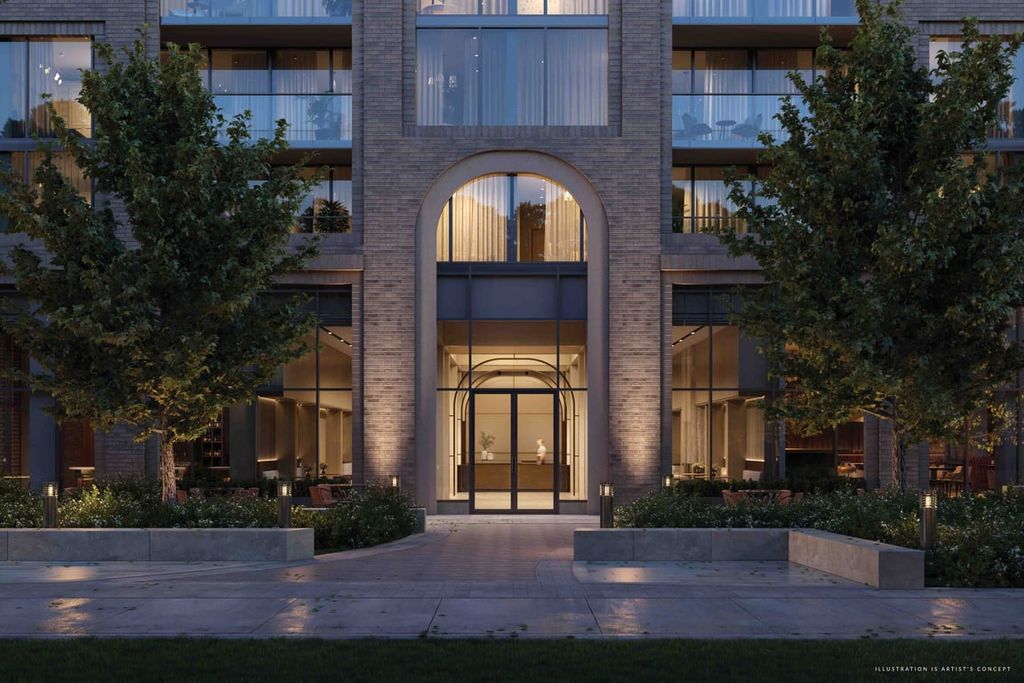
Arcadia District Condos - 56 Fieldway Rd - c0315_judge_podium - Toronto, ON, M8Z 3L2
422 sqft
422 sqft
MULTIMEDIA
Mortgage | |
---|---|
Purchase Price | $ |
Down Payment % | $111,597 |
Mortgage Amount | $446,393 |
Mortgage Payment % | $2,316 |
Income | |
---|---|
Gross Rental Income | $ |
Vacancy Rate % | $ |
Other | $ |
Gross Operating Income | $614 |
Operating Expenses | |
Management Fees % | $ |
Property Tax | $ |
Repair Reserve % | $ |
Insurance | $ |
Condo/Strata Fees | $ |
Total Operating Expenses | $487 |
Net Operating Income | $126 |
Debt Service | |
Mortgage Payment | $2,316 |
Net Cash Flow | -$2,189 |
Year 1 | Year 2 | Year 3 | Year 4 | Year 5 | Year 6 | Year 7 | Year 8 | Year 9 | Year 10 | |
---|---|---|---|---|---|---|---|---|---|---|
Investments | ||||||||||
Deposits | $55,798 | - | $55,799 | - | - | - | - | - | - | - |
Closing Costs | - | - | $31,769 | - | - | - | - | - | - | - |
Mortgage Paydown | - | - | $5,765 | $7,222 | $7,569 | $7,933 | $8,314 | $8,714 | $9,133 | $9,572 |
Total | $55,798 | $0 | $93,333 | $7,222 | $7,569 | $7,933 | $8,314 | $8,714 | $9,133 | $9,572 |
Cash Invested | $55,798 | $55,798 | $149,131 | $156,353 | $163,923 | $171,856 | $180,171 | $188,885 | $198,019 | $207,591 |
Rental Cash Flows | ||||||||||
Rent and other income | - | - | $6,140 | $7,632 | $7,960 | $8,302 | $8,659 | $9,031 | $9,420 | $9,825 |
Operating Expenses | - | - | -$4,871 | -$5,956 | -$6,091 | -$6,230 | -$6,372 | -$6,518 | -$6,668 | -$6,821 |
Mortgage Payment | - | - | -$23,161 | -$27,793 | -$27,793 | -$27,793 | -$27,793 | -$27,793 | -$27,793 | -$27,793 |
Net Cash Flow | - | - | -$21,892 | -$26,117 | -$25,925 | -$25,721 | -$25,507 | -$25,280 | -$25,041 | -$24,790 |
Returns | ||||||||||
Property Price Appreciation | $27,899 | $29,294 | $30,759 | $32,297 | $33,912 | $35,607 | $37,387 | $39,257 | $41,220 | $43,281 |
Mortgage Paydown | - | - | $5,765 | $7,222 | $7,569 | $7,933 | $8,314 | $8,714 | $9,133 | $9,572 |
Net Cash Flow | - | - | -$21,892 | -$26,117 | -$25,925 | -$25,721 | -$25,507 | -$25,280 | -$25,041 | -$24,790 |
Total Return | $27,899 | $29,294 | $14,631 | $13,401 | $15,556 | $17,819 | $20,195 | $22,691 | $25,311 | $28,063 |
Cumulative Return | $27,899 | $57,193 | $71,825 | $85,227 | $100,783 | $118,602 | $138,798 | $161,489 | $186,801 | $214,864 |
Investment Metrics | ||||||||||
Cumulative ROI | 50.0% | 102.5% | 48.2% | 54.5% | 61.5% | 69.0% | 77.0% | 85.5% | 94.3% | 103.5% |
Cash On Cash | - | - | -14.7% | -16.7% | -15.8% | -15.0% | -14.2% | -13.4% | -12.6% | -11.9% |