


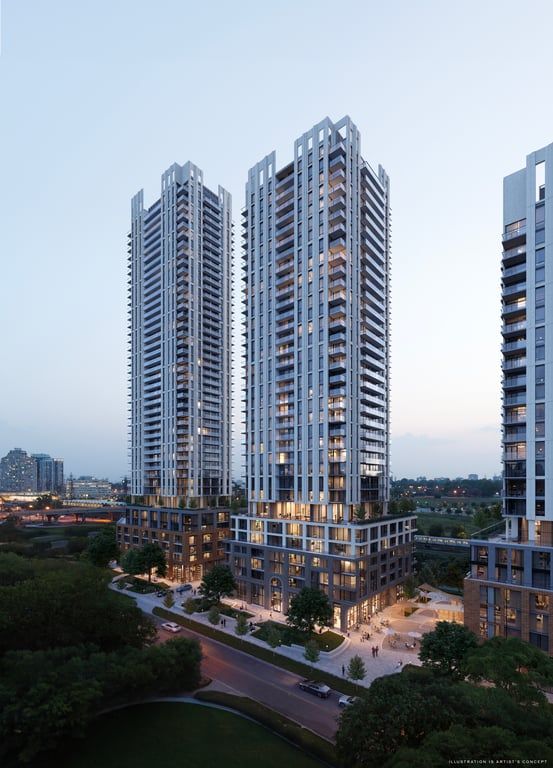


c0304_eagle_tower-56 Fieldway Rd, Toronto, ON, M8Z 3L2
Toronto ON, M8Z 3L2
MLS® # PB1126-C0304_EAGLE_TOWER


2 Beds
1 Bath
556 sqft
Toronto ON, M8Z 3L2
| Mortgage | |
|---|---|
| Purchase Price | $ |
| Down Payment % | $131,997 |
| Mortgage Amount | $527,993 |
| Mortgage Payment % | $2,739 |
| Income | |
|---|---|
| Gross Rental Income | $ |
| Vacancy Rate % | $ |
| Other | $ |
| Gross Operating Income | $1,617 |
| Operating Expenses | |
| Management Fees % | $ |
| Property Tax | $ |
| Repair Reserve % | $ |
| Insurance | $ |
| Condo/Strata Fees | $ |
| Total Operating Expenses | $698 |
| Net Operating Income | $919 |
| Debt Service | |
| Mortgage Payment | $2,739 |
| Net Cash Flow | -$1,820 |
| Year 1 | Year 2 | Year 3 | Year 4 | Year 5 | Year 6 | Year 7 | Year 8 | Year 9 | Year 10 | |
|---|---|---|---|---|---|---|---|---|---|---|
| Investments | ||||||||||
| Deposits | $65,998 | $65,999 | - | - | - | - | - | - | - | - |
| Closing Costs | - | - | $35,849 | - | - | - | - | - | - | - |
| Mortgage Paydown | - | - | $8,215 | $8,609 | $9,023 | $9,457 | $9,911 | $10,388 | $10,887 | $11,410 |
| Total | $65,998 | $65,999 | $44,064 | $8,609 | $9,023 | $9,457 | $9,911 | $10,388 | $10,887 | $11,410 |
| Cash Invested | $65,998 | $131,997 | $176,061 | $184,670 | $193,694 | $203,151 | $213,063 | $223,452 | $234,339 | $245,750 |
| Rental Cash Flows | ||||||||||
| Rent and other income | - | - | $19,415 | $20,250 | $21,121 | $22,029 | $22,976 | $23,964 | $24,995 | $26,069 |
| Operating Expenses | - | - | -$8,385 | -$8,594 | -$8,809 | -$9,030 | -$9,258 | -$9,492 | -$9,733 | -$9,981 |
| Mortgage Payment | - | - | -$32,874 | -$32,874 | -$32,874 | -$32,874 | -$32,874 | -$32,874 | -$32,874 | -$32,874 |
| Net Cash Flow | - | - | -$21,843 | -$21,218 | -$20,562 | -$19,875 | -$19,155 | -$18,402 | -$17,612 | -$16,785 |
| Returns | ||||||||||
| Property Price Appreciation | $32,999 | $34,649 | $36,381 | $38,201 | $40,111 | $42,116 | $44,222 | $46,433 | $48,755 | $51,193 |
| Mortgage Paydown | - | - | $8,215 | $8,609 | $9,023 | $9,457 | $9,911 | $10,388 | $10,887 | $11,410 |
| Net Cash Flow | - | - | -$21,843 | -$21,218 | -$20,562 | -$19,875 | -$19,155 | -$18,402 | -$17,612 | -$16,785 |
| Total Return | $32,999 | $34,649 | $22,752 | $25,592 | $28,572 | $31,698 | $34,978 | $38,419 | $42,030 | $45,818 |
| Cumulative Return | $32,999 | $67,648 | $90,401 | $115,994 | $144,566 | $176,265 | $211,243 | $249,663 | $291,693 | $337,511 |
| Investment Metrics | ||||||||||
| Cumulative ROI | 50.0% | 51.3% | 51.3% | 62.8% | 74.6% | 86.8% | 99.1% | 111.7% | 124.5% | 137.3% |
| Cash On Cash | - | - | -12.4% | -11.5% | -10.6% | -9.8% | -9.0% | -8.2% | -7.5% | -6.8% |
-3.52%
Price change (1 year)
4.81%
Price change (5 years)
-1.12%
Price change (1 year)
24.59%
Price change (5 years)
