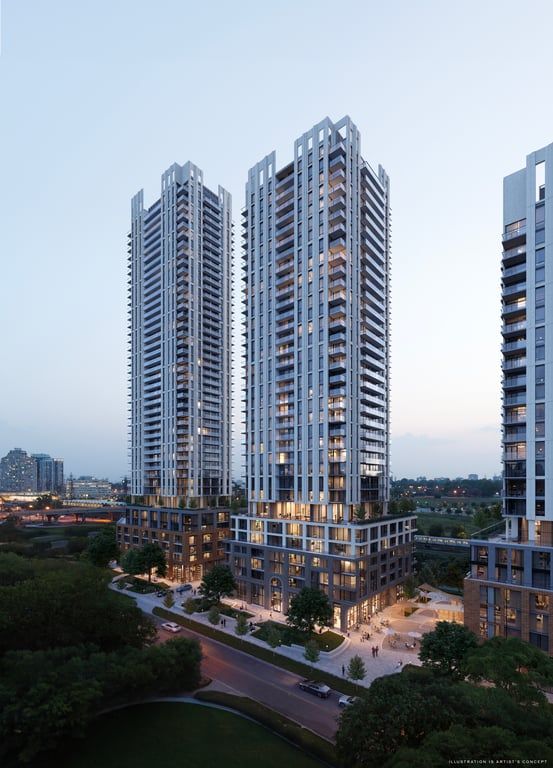
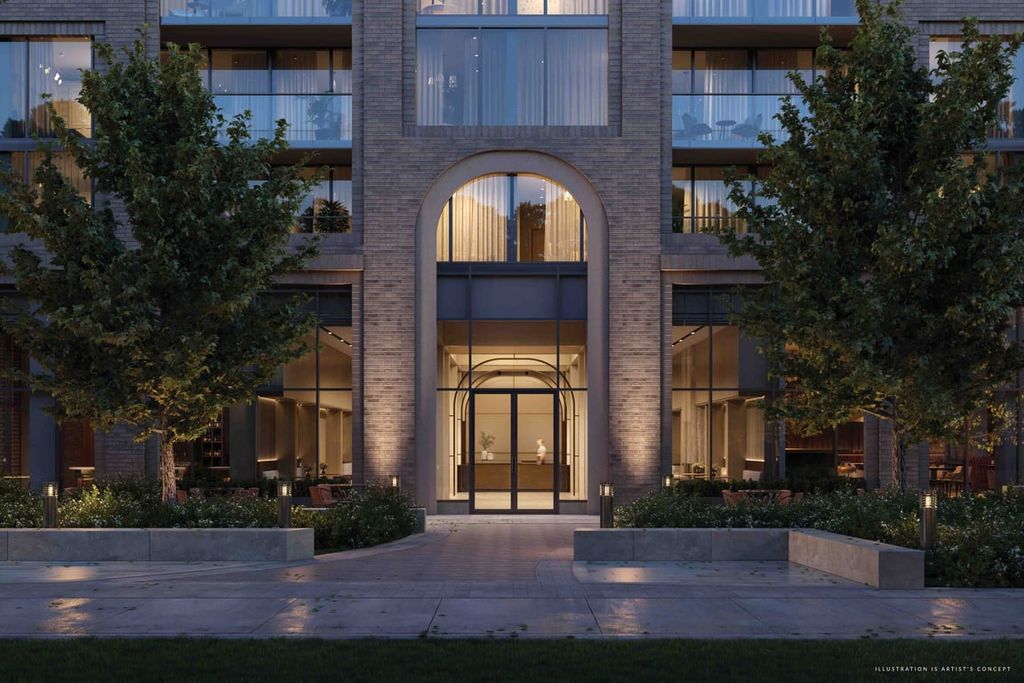
Arcadia District Condos
- c0211_kellogg_podium
56 Fieldway Rd
Toronto ON, M8Z 3L2
3.0 Beds
2 Baths
885 sqft
Toronto ON, M8Z 3L2
Mortgage | |
---|---|
Purchase Price | $ |
Down Payment % | $184,397 |
Mortgage Amount | $737,593 |
Mortgage Payment % | $3,827 |
Income | |
---|---|
Gross Rental Income | $ |
Vacancy Rate % | $ |
Other | $ |
Gross Operating Income | $2,575 |
Operating Expenses | |
Management Fees % | $ |
Property Tax | $ |
Repair Reserve % | $ |
Insurance | $ |
Condo/Strata Fees | $ |
Total Operating Expenses | $1,079 |
Net Operating Income | $1,495 |
Debt Service | |
Mortgage Payment | $3,827 |
Net Cash Flow | -$2,331 |
Year 1 | Year 2 | Year 3 | Year 4 | Year 5 | Year 6 | Year 7 | Year 8 | Year 9 | Year 10 | |
---|---|---|---|---|---|---|---|---|---|---|
Investments | ||||||||||
Deposits | $92,198 | - | $92,199 | - | - | - | - | - | - | - |
Closing Costs | - | - | $46,329 | - | - | - | - | - | - | - |
Mortgage Paydown | - | - | $9,525 | $11,934 | $12,507 | $13,108 | $13,738 | $14,399 | $15,091 | $15,816 |
Total | $92,198 | $0 | $148,053 | $11,934 | $12,507 | $13,108 | $13,738 | $14,399 | $15,091 | $15,816 |
Cash Invested | $92,198 | $92,198 | $240,251 | $252,185 | $264,693 | $277,802 | $291,541 | $305,940 | $321,031 | $336,847 |
Rental Cash Flows | ||||||||||
Rent and other income | - | - | $25,753 | $32,011 | $33,388 | $34,823 | $36,321 | $37,883 | $39,511 | $41,211 |
Operating Expenses | - | - | -$10,796 | -$13,226 | -$13,558 | -$13,901 | -$14,253 | -$14,616 | -$14,989 | -$15,373 |
Mortgage Payment | - | - | -$38,270 | -$45,924 | -$45,924 | -$45,924 | -$45,924 | -$45,924 | -$45,924 | -$45,924 |
Net Cash Flow | - | - | -$23,313 | -$27,139 | -$26,095 | -$25,002 | -$23,857 | -$22,657 | -$21,402 | -$20,087 |
Returns | ||||||||||
Property Price Appreciation | $46,099 | $48,404 | $50,824 | $53,365 | $56,034 | $58,835 | $61,777 | $64,866 | $68,109 | $71,515 |
Mortgage Paydown | - | - | $9,525 | $11,934 | $12,507 | $13,108 | $13,738 | $14,399 | $15,091 | $15,816 |
Net Cash Flow | - | - | -$23,313 | -$27,139 | -$26,095 | -$25,002 | -$23,857 | -$22,657 | -$21,402 | -$20,087 |
Total Return | $46,099 | $48,404 | $37,037 | $38,160 | $42,446 | $46,942 | $51,659 | $56,607 | $61,799 | $67,244 |
Cumulative Return | $46,099 | $94,503 | $131,541 | $169,702 | $212,148 | $259,090 | $310,750 | $367,358 | $429,157 | $496,401 |
Investment Metrics | ||||||||||
Cumulative ROI | 50.0% | 102.5% | 54.8% | 67.3% | 80.1% | 93.3% | 106.6% | 120.1% | 133.7% | 147.4% |
Cash On Cash | - | - | -9.7% | -10.8% | -9.9% | -9.0% | -8.2% | -7.4% | -6.7% | -6.0% |
4.79%
Price change (1 year)
46.95%
Price change (5 years)