


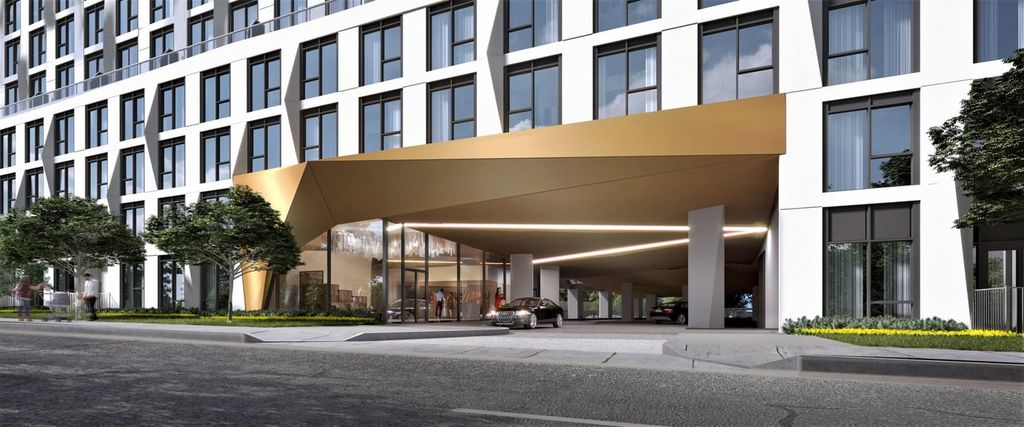


Westerly 1 & 2 Condos
- 2s_d_westerly_1
1276 Central Park Roadway
Toronto ON, M9A 3J9
MLS® # PB1195-2S_D_WESTERLY_1
