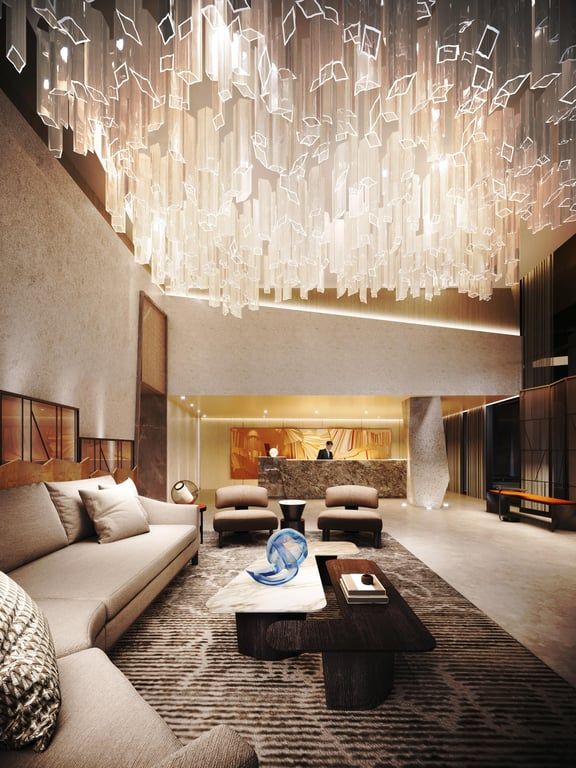
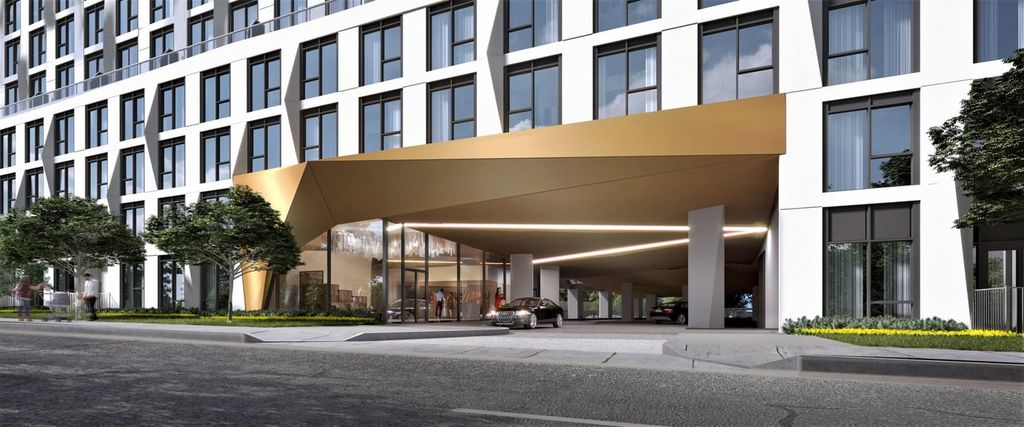
Westerly 1 & 2 Condos - 1276 Central Park Roadway - 1a_dat_westerly_2 - Toronto, ON, M9A 3J9
1.0 Beds
1 Bath
596 sqft
1.0 Beds
1 Bath
596 sqft
MULTIMEDIA
Mortgage | |
---|---|
Purchase Price | $ |
Down Payment % | $162,800 |
Mortgage Amount | $651,200 |
Mortgage Payment % | $3,378 |
Income | |
---|---|
Gross Rental Income | $ |
Vacancy Rate % | $ |
Other | $ |
Gross Operating Income | $1,156 |
Operating Expenses | |
Management Fees % | $ |
Property Tax | $ |
Repair Reserve % | $ |
Insurance | $ |
Condo/Strata Fees | $ |
Total Operating Expenses | $751 |
Net Operating Income | $404 |
Debt Service | |
Mortgage Payment | $3,378 |
Net Cash Flow | -$2,973 |
Year 1 | Year 2 | Year 3 | Year 4 | Year 5 | Year 6 | Year 7 | Year 8 | Year 9 | Year 10 | |
---|---|---|---|---|---|---|---|---|---|---|
Investments | ||||||||||
Deposits | $162,800 | - | - | - | - | - | - | - | - | - |
Closing Costs | $42,010 | - | - | - | - | - | - | - | - | - |
Mortgage Paydown | $5,006 | $10,372 | $10,871 | $11,393 | $11,941 | $12,515 | $13,116 | $13,747 | $14,407 | $15,100 |
Total | $209,816 | $10,372 | $10,871 | $11,393 | $11,941 | $12,515 | $13,116 | $13,747 | $14,407 | $15,100 |
Cash Invested | $209,816 | $220,189 | $231,060 | $242,453 | $254,395 | $266,910 | $280,027 | $293,774 | $308,182 | $323,282 |
Rental Cash Flows | ||||||||||
Rent and other income | $6,937 | $14,173 | $14,782 | $15,418 | $16,081 | $16,772 | $17,493 | $18,246 | $19,030 | $19,849 |
Operating Expenses | -$4,507 | -$9,120 | -$9,333 | -$9,551 | -$9,775 | -$10,005 | -$10,241 | -$10,483 | -$10,732 | -$10,987 |
Mortgage Payment | -$20,272 | -$40,545 | -$40,545 | -$40,545 | -$40,545 | -$40,545 | -$40,545 | -$40,545 | -$40,545 | -$40,545 |
Net Cash Flow | -$17,843 | -$35,493 | -$35,096 | -$34,678 | -$34,239 | -$33,778 | -$33,292 | -$32,782 | -$32,246 | -$31,683 |
Returns | ||||||||||
Property Price Appreciation | $40,700 | $42,734 | $44,871 | $47,115 | $49,471 | $51,944 | $54,541 | $57,268 | $60,132 | $63,139 |
Mortgage Paydown | $5,006 | $10,372 | $10,871 | $11,393 | $11,941 | $12,515 | $13,116 | $13,747 | $14,407 | $15,100 |
Net Cash Flow | -$17,843 | -$35,493 | -$35,096 | -$34,678 | -$34,239 | -$33,778 | -$33,292 | -$32,782 | -$32,246 | -$31,683 |
Total Return | $27,863 | $17,614 | $20,646 | $23,829 | $27,172 | $30,681 | $34,365 | $38,233 | $42,293 | $46,555 |
Cumulative Return | $27,863 | $45,477 | $66,124 | $89,954 | $117,126 | $147,808 | $182,173 | $220,407 | $262,700 | $309,256 |
Investment Metrics | ||||||||||
Cumulative ROI | 13.3% | 20.7% | 28.6% | 37.1% | 46.0% | 55.4% | 65.1% | 75.0% | 85.2% | 95.7% |
Cash On Cash | -8.5% | -16.1% | -15.2% | -14.3% | -13.5% | -12.7% | -11.9% | -11.2% | -10.5% | -9.8% |
1.7%
Price change (1 year)
50.45%
Price change (5 years)