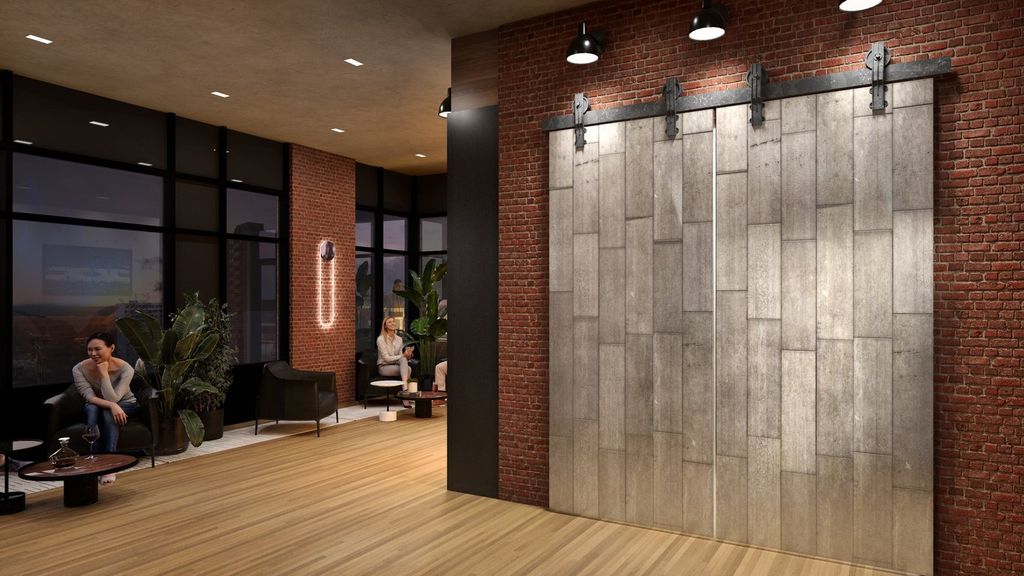
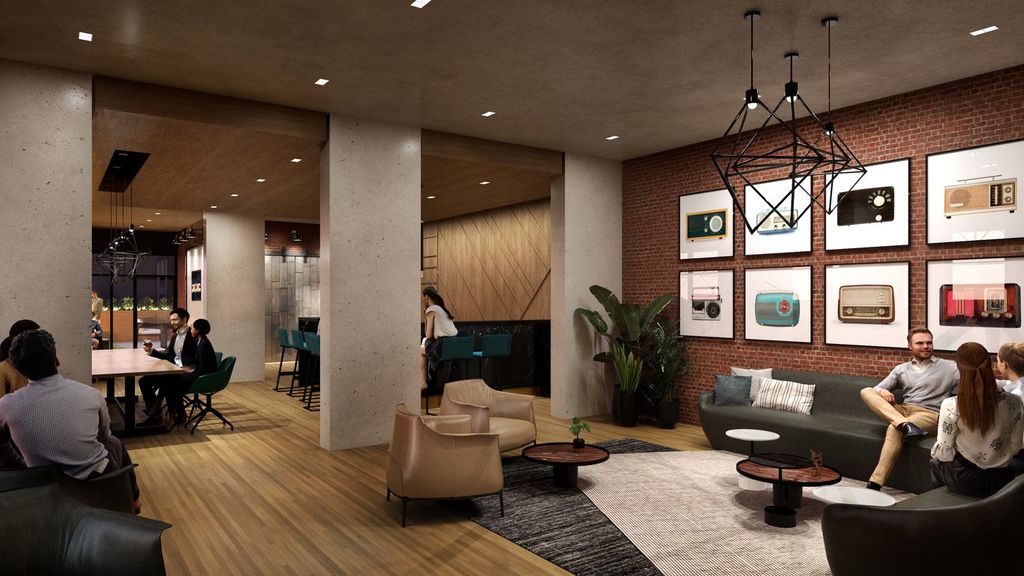
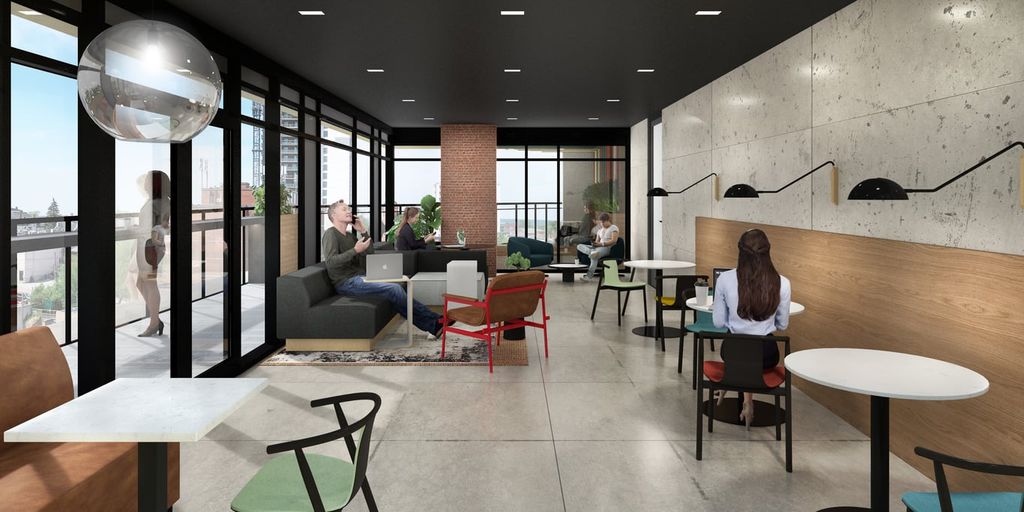
Radio Arts - 206 King St W - 408_broadcast - Hamilton, ON, L8P 1A5
485 sqft
485 sqft
MULTIMEDIA
Mortgage | |
---|---|
Purchase Price | $ |
Down Payment % | $109,598 |
Mortgage Amount | $438,392 |
Mortgage Payment % | $2,274 |
Income | |
---|---|
Gross Rental Income | $ |
Vacancy Rate % | $ |
Other | $ |
Gross Operating Income | $488 |
Operating Expenses | |
Management Fees % | $ |
Property Tax | $ |
Repair Reserve % | $ |
Insurance | $ |
Condo/Strata Fees | $ |
Total Operating Expenses | $491 |
Net Operating Income | -$3 |
Debt Service | |
Mortgage Payment | $2,274 |
Net Cash Flow | -$2,277 |
Year 1 | Year 2 | Year 3 | Year 4 | Year 5 | Year 6 | Year 7 | Year 8 | Year 9 | Year 10 | |
---|---|---|---|---|---|---|---|---|---|---|
Investments | ||||||||||
Deposits | $68,497 | - | - | - | - | - | - | - | - | - |
Closing Costs | $65,035 | - | - | - | - | - | - | - | - | - |
Mortgage Paydown | $5,085 | $7,065 | $7,404 | $7,760 | $8,133 | $8,524 | $8,934 | $9,363 | $9,814 | $10,285 |
Total | $138,617 | $7,065 | $7,404 | $7,760 | $8,133 | $8,524 | $8,934 | $9,363 | $9,814 | $10,285 |
Cash Invested | $138,617 | $145,682 | $153,087 | $160,848 | $168,982 | $177,507 | $186,441 | $195,805 | $205,619 | $215,905 |
Rental Cash Flows | ||||||||||
Rent and other income | $4,398 | $6,054 | $6,314 | $6,585 | $6,869 | $7,164 | $7,472 | $7,793 | $8,128 | $8,478 |
Operating Expenses | -$4,427 | -$6,001 | -$6,134 | -$6,270 | -$6,409 | -$6,551 | -$6,697 | -$6,847 | -$7,000 | -$7,157 |
Mortgage Payment | -$20,471 | -$27,295 | -$27,295 | -$27,295 | -$27,295 | -$27,295 | -$27,295 | -$27,295 | -$27,295 | -$27,295 |
Net Cash Flow | -$20,500 | -$27,242 | -$27,115 | -$26,979 | -$26,835 | -$26,682 | -$26,520 | -$26,349 | -$26,167 | -$25,974 |
Returns | ||||||||||
Property Price Appreciation | $27,399 | $28,769 | $30,207 | $31,718 | $33,304 | $34,969 | $36,717 | $38,553 | $40,481 | $42,505 |
Mortgage Paydown | $5,085 | $7,065 | $7,404 | $7,760 | $8,133 | $8,524 | $8,934 | $9,363 | $9,814 | $10,285 |
Net Cash Flow | -$20,500 | -$27,242 | -$27,115 | -$26,979 | -$26,835 | -$26,682 | -$26,520 | -$26,349 | -$26,167 | -$25,974 |
Total Return | $11,984 | $8,591 | $10,497 | $12,499 | $14,602 | $16,811 | $19,131 | $21,568 | $24,128 | $26,816 |
Cumulative Return | $11,984 | $20,576 | $31,073 | $43,573 | $58,175 | $74,987 | $94,118 | $115,687 | $139,815 | $166,631 |
Investment Metrics | ||||||||||
Cumulative ROI | 8.6% | 14.1% | 20.3% | 27.1% | 34.4% | 42.2% | 50.5% | 59.1% | 68.0% | 77.2% |
Cash On Cash | -14.8% | -18.7% | -17.7% | -16.8% | -15.9% | -15.0% | -14.2% | -13.5% | -12.7% | -12.0% |
2.88%
Price change (1 year)
92.84%
Price change (5 years)