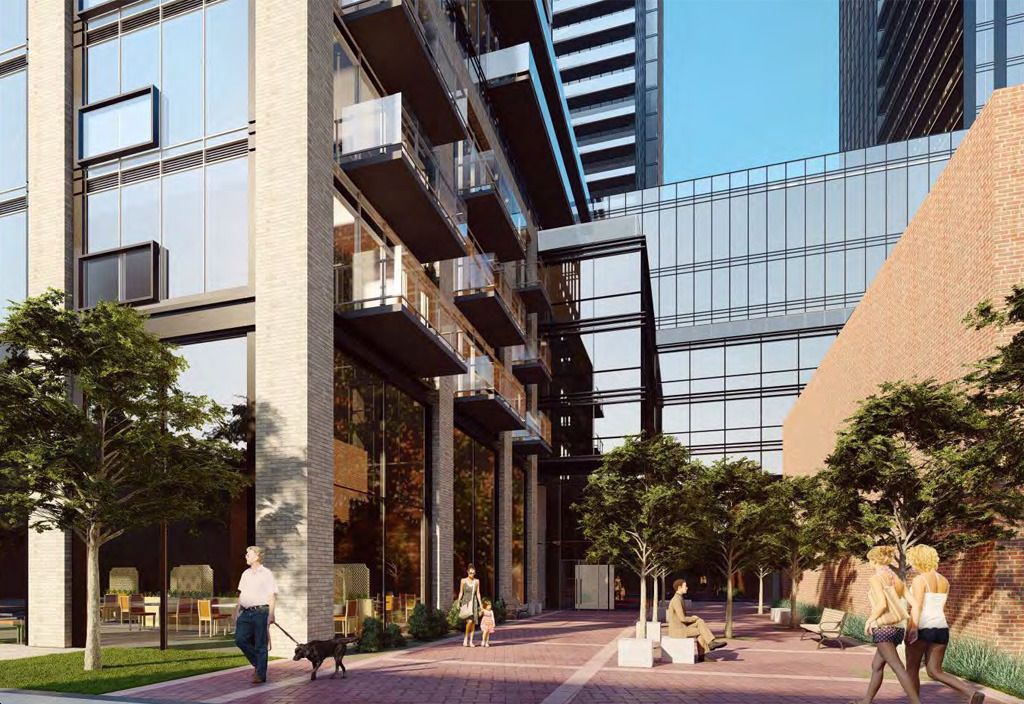
The Design District Condos - 41 Wilson St - 1310_basalt - Hamilton, ON, L8R 1C6
2.5 Beds
2 Baths
822 sqft
2.5 Beds
2 Baths
822 sqft
MULTIMEDIA
Mortgage | |
---|---|
Purchase Price | $ |
Down Payment % | $139,980 |
Mortgage Amount | $559,920 |
Mortgage Payment % | $2,905 |
Income | |
---|---|
Gross Rental Income | $ |
Vacancy Rate % | $ |
Other | $ |
Gross Operating Income | $2,392 |
Operating Expenses | |
Management Fees % | $ |
Property Tax | $ |
Repair Reserve % | $ |
Insurance | $ |
Condo/Strata Fees | $ |
Total Operating Expenses | $897 |
Net Operating Income | $1,494 |
Debt Service | |
Mortgage Payment | $2,905 |
Net Cash Flow | -$1,410 |
Year 1 | Year 2 | Year 3 | Year 4 | Year 5 | Year 6 | Year 7 | Year 8 | Year 9 | Year 10 | |
---|---|---|---|---|---|---|---|---|---|---|
Investments | ||||||||||
Deposits | $34,994 | $104,984 | - | - | - | - | - | - | - | - |
Closing Costs | - | $26,975 | - | - | - | - | - | - | - | - |
Mortgage Paydown | - | $2,858 | $8,849 | $9,274 | $9,720 | $10,187 | $10,677 | $11,190 | $11,728 | $12,291 |
Total | $34,994 | $134,817 | $8,849 | $9,274 | $9,720 | $10,187 | $10,677 | $11,190 | $11,728 | $12,291 |
Cash Invested | $34,994 | $169,811 | $178,660 | $187,935 | $197,655 | $207,842 | $218,519 | $229,710 | $241,438 | $253,730 |
Rental Cash Flows | ||||||||||
Rent and other income | - | $9,568 | $29,115 | $30,367 | $31,673 | $33,035 | $34,455 | $35,937 | $37,482 | $39,094 |
Operating Expenses | - | -$3,589 | -$10,860 | -$11,139 | -$11,427 | -$11,723 | -$12,028 | -$12,342 | -$12,666 | -$12,999 |
Mortgage Payment | - | -$11,620 | -$34,862 | -$34,862 | -$34,862 | -$34,862 | -$34,862 | -$34,862 | -$34,862 | -$34,862 |
Net Cash Flow | - | -$5,642 | -$16,607 | -$15,634 | -$14,616 | -$13,550 | -$12,434 | -$11,267 | -$10,045 | -$8,767 |
Returns | ||||||||||
Property Price Appreciation | $34,995 | $36,744 | $38,581 | $40,511 | $42,536 | $44,663 | $46,896 | $49,241 | $51,703 | $54,288 |
Mortgage Paydown | - | $2,858 | $8,849 | $9,274 | $9,720 | $10,187 | $10,677 | $11,190 | $11,728 | $12,291 |
Net Cash Flow | - | -$5,642 | -$16,607 | -$15,634 | -$14,616 | -$13,550 | -$12,434 | -$11,267 | -$10,045 | -$8,767 |
Total Return | $34,995 | $33,961 | $30,823 | $34,151 | $37,640 | $41,300 | $45,138 | $49,164 | $53,385 | $57,813 |
Cumulative Return | $34,995 | $68,956 | $99,780 | $133,931 | $171,571 | $212,872 | $258,011 | $307,175 | $360,561 | $418,374 |
Investment Metrics | ||||||||||
Cumulative ROI | 100.0% | 40.6% | 55.8% | 71.3% | 86.8% | 102.4% | 118.1% | 133.7% | 149.3% | 164.9% |
Cash On Cash | - | -3.3% | -9.3% | -8.3% | -7.4% | -6.5% | -5.7% | -4.9% | -4.2% | -3.5% |