LiveEn Direct
Button CopyPathCircle CloseCircle Left ArrowArrow Down Icon GreyClosecirclecircleBurger
Image 1
Image 2
Image 3
$522,990

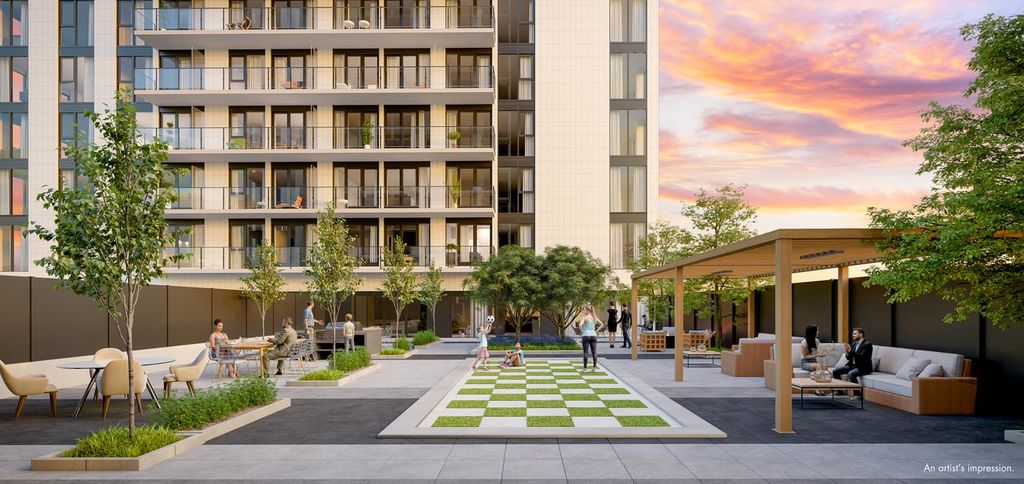
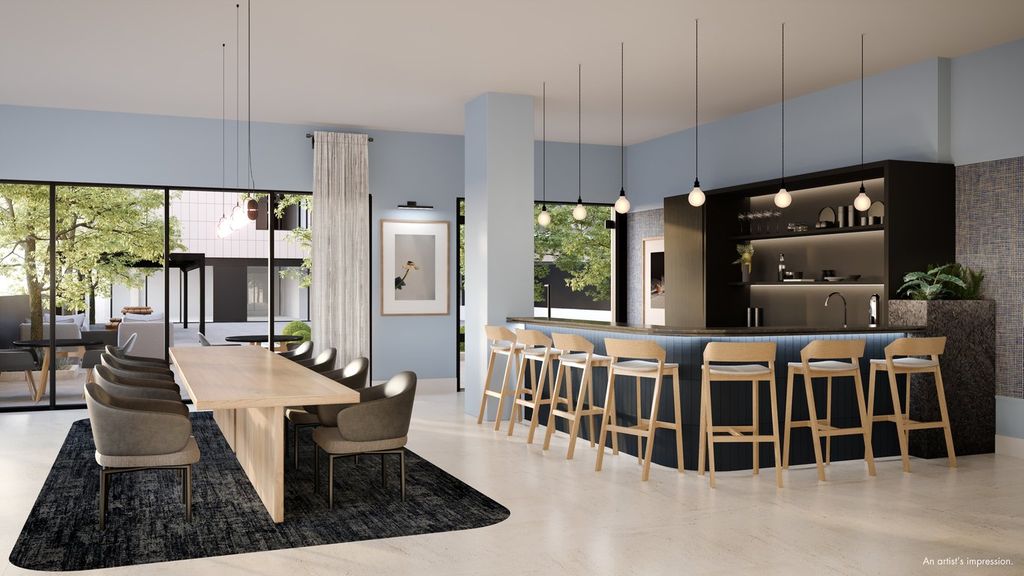
1989 Condos - 1989 Appleby Line - 1b_c_podium - Burlington, ON, L7L 6K3

MLS® # PB1171-1B_C_PODIUM

1.0 Beds

1 Bath

488 sqft

1b_C_Podium - 1989 Condos by Latch Developments

Property Features:

  • Bedrooms: 1.0
  • Bathrooms: 1.0
  • Floor Space (approx): 488

This listing content provided by Brokers PlaybookTM

Potential Investment Performance

Cumulative ROI

89.1%

Cumulative Market Appreciation

$144,492

Net Operating Income in Year 5

$7,641

Cash on Cash Return in Year 5

-14.3%

Assumptions

The information below is based on user inputs and general assumptions for informational purposes only. The outputs are not legal, financial, investment, or other advice. Review all fields for accuracy and consult an agent for guidance.

Mortgage Calculator

Mortgage
Purchase Price
$
Down Payment
%
$104,598
Mortgage Amount $418,392
Mortgage Payment
%
$2,170

Cash Flow Calculator

monthly
yearly
Income
Gross Rental Income
Powered By
$
Vacancy Rate
%
$
Other
$
Gross Operating Income $951
Operating Expenses
Management Fees
%
$
Property Tax
$
Repair Reserve
%
$
Insurance
$
Condo/Strata Fees
$
Total Operating Expenses $452
Net Operating Income $499
Debt Service
Mortgage Payment $2,170
Net Cash Flow -$1,671

Acquistion Costs

Deposit $104,596
Land Transfer Tax $6,934
Legal Fees $1,500
Adjustments $0
Development Charges $15,000
Down Payment Balance $2
Total Acquisition Costs $128,032

Deposit Schedule

With the Offer $5,000
Deposit @ 30 days $21,149
Deposit @ 0 days $26,149
Due on Occupancy $26,149
Total Deposit $104,596
Closing Date Sep 1, 2028

Components of Return

Potential Returns

Year 1Year 2Year 3Year 4Year 5Year 6Year 7Year 8Year 9Year 10
Investments
Deposits $78,447 - - $26,149 - - - - - -
Closing Costs - - - $23,436 - - - - - -
Mortgage Paydown - - - $3,760$6,690$7,012$7,349$7,702$8,072$8,460
Total $78,447$0$0$53,345$6,690$7,012$7,349$7,702$8,072$8,460
Cash Invested $78,447$78,447$78,447$131,792$138,482$145,494$152,843$160,545$168,618$177,078
Rental Cash Flows
Rent and other income - - - $6,661$11,705$12,208$12,733$13,281$13,852$14,448
Operating Expenses - - - -$3,164-$5,502-$5,637-$5,775-$5,918-$6,065-$6,215
Mortgage Payment - - - -$15,196-$26,050-$26,050-$26,050-$26,050-$26,050-$26,050
Net Cash Flow - - - -$11,699-$19,847-$19,478-$19,092-$18,687-$18,262-$17,817
Returns
Property Price Appreciation $26,149$27,456$28,829$30,271$31,784$33,374$35,042$36,794$38,634$40,566
Mortgage Paydown - - - $3,760$6,690$7,012$7,349$7,702$8,072$8,460
Net Cash Flow - - - -$11,699-$19,847-$19,478-$19,092-$18,687-$18,262-$17,817
Total Return $26,149$27,456$28,829$22,332$18,628$20,907$23,299$25,809$28,444$31,209
Cumulative Return $26,149$53,606$82,436$104,768$123,396$144,304$167,603$193,413$221,858$253,067
Investment Metrics
Cumulative ROI 33.3% 68.3% 105.1% 79.5% 89.1% 99.2% 109.7% 120.5% 131.6% 142.9%
Cash On Cash - - - -8.9% -14.3% -13.4% -12.5% -11.6% -10.8% -10.1%

Location of 1b_c_podium-1989 Appleby Line, Burlington, ON, L7L 6K3

Demographic Information of 1b_c_podium-1989 Appleby Line, Burlington, ON, L7L 6K3

Life Stage

Young Families

Employment Type

Mixed

Average Household Income

$148,644.18

Average Number of Children

1.64

Household Population

Household Structure

Age of Population

Education

Education Level

No certificate/diploma/degree

9.42 %

High school certificate or equivalent

28.87 %

Apprenticeship trade certificate/diploma

3.61 %

College/non-university certificate

21.09 %

University certificate (below bachelor)

4.49 %

University Degree

32.52 %

Commuter

Travel To Work

By Car

87.23 %

By Public Transit

6.18 %

By Walking

1.38 %

By Bicycle

0.09 %

By Other Methods

5.12 %

Cultural Diversity

Knowledge of Official Language

Mother Tongue

Building Information

Building Type

Apartments (Low and High Rise)

41.3 %

Houses

58.7 %

Own Vs. Rent