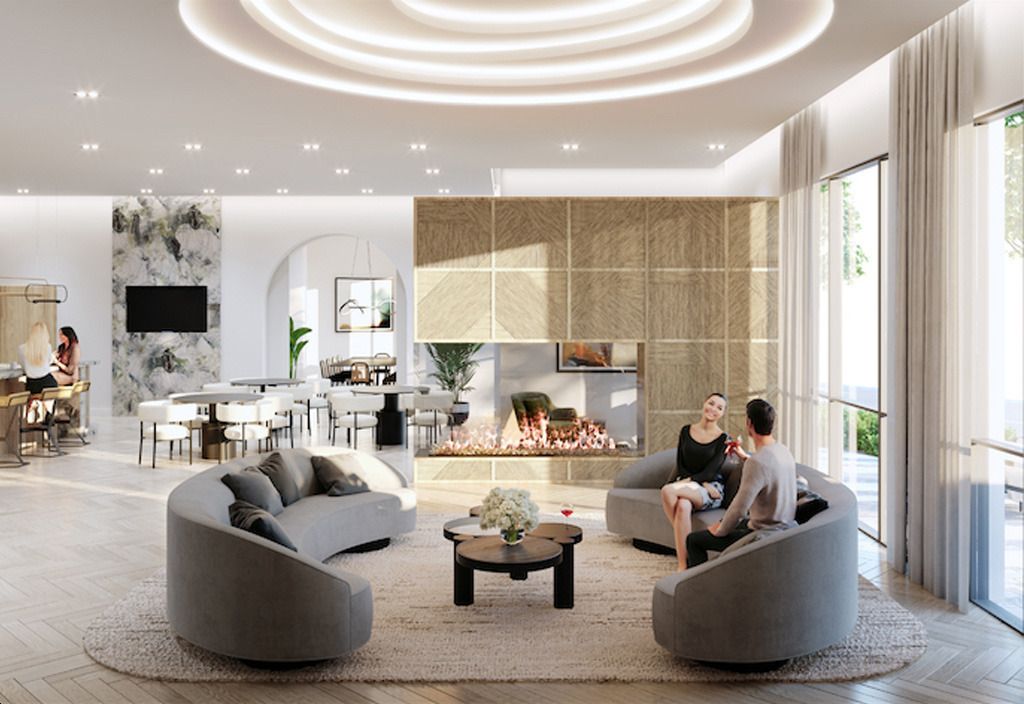
Stella 2 Condos - 209 Steeles Ave W - 2k_t - Brampton, ON, L6Y 0B5
2.0 Beds
2 Baths
657 sqft
2.0 Beds
2 Baths
657 sqft
MULTIMEDIA
Mortgage | |
---|---|
Purchase Price | $ |
Down Payment % | $157,400 |
Mortgage Amount | $629,598 |
Mortgage Payment % | $3,266 |
Income | |
---|---|
Gross Rental Income | $ |
Vacancy Rate % | $ |
Other | $ |
Gross Operating Income | $1,601 |
Operating Expenses | |
Management Fees % | $ |
Property Tax | $ |
Repair Reserve % | $ |
Insurance | $ |
Condo/Strata Fees | $ |
Total Operating Expenses | $764 |
Net Operating Income | $837 |
Debt Service | |
Mortgage Payment | $3,266 |
Net Cash Flow | -$2,429 |
Year 1 | Year 2 | Year 3 | Year 4 | Year 5 | Year 6 | Year 7 | Year 8 | Year 9 | Year 10 | |
---|---|---|---|---|---|---|---|---|---|---|
Investments | ||||||||||
Deposits | $39,348 | $118,047 | - | - | - | - | - | - | - | - |
Closing Costs | - | $28,718 | - | - | - | - | - | - | - | - |
Mortgage Paydown | - | $8,131 | $10,186 | $10,676 | $11,189 | $11,727 | $12,290 | $12,881 | $13,500 | $14,149 |
Total | $39,348 | $154,896 | $10,186 | $10,676 | $11,189 | $11,727 | $12,290 | $12,881 | $13,500 | $14,149 |
Cash Invested | $39,348 | $194,244 | $204,431 | $215,107 | $226,297 | $238,024 | $250,315 | $263,196 | $276,697 | $290,847 |
Rental Cash Flows | ||||||||||
Rent and other income | - | $16,014 | $19,905 | $20,761 | $21,654 | $22,585 | $23,556 | $24,569 | $25,626 | $26,728 |
Operating Expenses | - | -$7,643 | -$9,358 | -$9,587 | -$9,823 | -$10,066 | -$10,315 | -$10,571 | -$10,835 | -$11,106 |
Mortgage Payment | - | -$32,667 | -$39,200 | -$39,200 | -$39,200 | -$39,200 | -$39,200 | -$39,200 | -$39,200 | -$39,200 |
Net Cash Flow | - | -$24,295 | -$28,653 | -$28,026 | -$27,369 | -$26,681 | -$25,959 | -$25,202 | -$24,409 | -$23,578 |
Returns | ||||||||||
Property Price Appreciation | $39,349 | $41,317 | $43,383 | $45,552 | $47,830 | $50,221 | $52,732 | $55,369 | $58,137 | $61,044 |
Mortgage Paydown | - | $8,131 | $10,186 | $10,676 | $11,189 | $11,727 | $12,290 | $12,881 | $13,500 | $14,149 |
Net Cash Flow | - | -$24,295 | -$28,653 | -$28,026 | -$27,369 | -$26,681 | -$25,959 | -$25,202 | -$24,409 | -$23,578 |
Total Return | $39,349 | $25,152 | $24,916 | $28,201 | $31,649 | $35,267 | $39,064 | $43,048 | $47,228 | $51,615 |
Cumulative Return | $39,349 | $64,502 | $89,419 | $117,621 | $149,270 | $184,538 | $223,602 | $266,650 | $313,879 | $365,495 |
Investment Metrics | ||||||||||
Cumulative ROI | 100.0% | 33.2% | 43.7% | 54.7% | 66.0% | 77.5% | 89.3% | 101.3% | 113.4% | 125.7% |
Cash On Cash | - | -12.5% | -14.0% | -13.0% | -12.1% | -11.2% | -10.4% | -9.6% | -8.8% | -8.1% |
22.1%
Price change (1 year)
94.92%
Price change (5 years)
22.1%
Price change (1 year)
94.92%
Price change (5 years)