Button CopyPathCircle CloseCircle Left ArrowArrow Down Icon GreyClosecirclecircleBurger
  • Advertising

11 Yetmans Lane, Eastport, Newfoundland & Labrador, A0G 1Z0

MLS® # 1273623
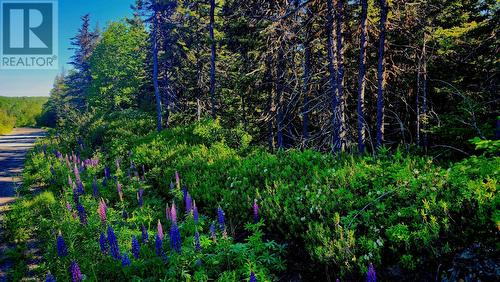
Vacant Land For Sale In Eastport, Newfoundland and Labrador
$55,000
11 Yetmans Lane, Eastport, NL
  • Advertising
ACTIVE
11 Yetmans Lane, Eastport, Newfoundland & Labrador, A0G 1Z0
$55,000

Property Information:

This large parcel of land is within minutes walking distance to Eastport Beach. Eastport is a popular area and has many cultural events, scenic locations, and delightful activities. Build that dream getaway and soak up the ocean scent, spend time combing the beautiful sandy beach, visit the multiple local communities in the area, and dwell in the peaceful environment. This dream location truly provides a fabulous spot for you to create that ideal get-away or permanent residence. Yetmans Lane is a quiet side road off of Lanes Road which is right across the street from the Eastport Beach. It has a 283 foot frontage with the town water supply in front and goes back 401 feet. (id:27)

Property Features:

  • OwnershipType: Freehold
  • Property Type: Vacant Land
  • Irregular: Yes
  • Lot Size: 2.6 acres
  • Zoning: res

Courtesy of: Keller Williams Platinum Realty

REALTOR.ca  

Location of 11 Yetmans Lane, Eastport, Newfoundland & Labrador, A0G 1Z0

Climate Risk Data

About Climate Risk: Properties are at increased risk of damage from extreme weather due to climate change.
ClimateCheck provides detailed climate risk data for properties now and up to 30 years into the future.

Projected Heat Risk: Relatively Low

22 hot days expected in 2050

Projected Storm Risk: Very High

15 storms expected in 2050

Projected Heat Risk: Relatively Low

22 hot days expected in 2050

18/100

Relatively Low

ClimateCheck®

Current data

This property, 11 Yetmans Lane , experiences 7 hot days per year at around 26.7 degrees Celsius.

Projected data

Severe heat risk is expected to increase in this area. In 2050, it is projected that there will be 22 hot days at 29.2 degrees Celsius.

Projected Avg. Temperature

Past
26.7℃
2050
29.2℃

# Hot Days Per Year

Past
7
2050
22

About Heat Risk

Heat risk is the number of extreme heat days experienced each year looking at historical conditions (1980-2005) in your area and taking the 2% of the hottest days and projecting that into the future.

Projected Storm Risk:

15 storms expected in 2050

70/100

ClimateCheck®

Current data

This property, 11 Yetmans Lane , experiences 11 significant 2-day storms per year, with about 342mm of precipitation per storm.

Projected data

Severe storms are expected to increase in this area. In 2050, it is projected that there will be 15 significant 2-day storms with 444.2mm of precipitation per year.

Precipitation Per Storm

Past
342mm
2050
444.2mm

48-Hour Storms Per Year

Past
11
2050
15

About Storm Risk

Storm risk is the number of high wind, wet or snowy events each year. Climate check looks at historical conditions (1980-2005) in your area, on the days with the top 1% of total precipitation in a year and projected to 2050.

Climate risk data is provided for informational purposes only on Royallepage.ca.
If you have questions or feedback about this data, get help at climatecheck.com.

Environmental Risks provided by ClimateCheck®

Royal LePage does not endorse nor guarantee this information. By providing this information, Royal LePage and its agents are not providing advice or guidance on climate risks. Royal LePage strongly recommends that consumers independently investigate the property’s climate risks to their own personal satisfaction.

Demographic Information of 11 Yetmans Lane, Eastport, Newfoundland & Labrador, A0G 1Z0

Life Stage

Older Couples

Employment Type

Blue Collar/Primary

Average Household Income

$76,000.00

Average Number of Children

1.50

Household Population

Household Structure

Age of Population

Education

Education Level

No certificate/diploma/degree

23.32 %

High school certificate or equivalent

35.47 %

Apprenticeship trade certificate/diploma

12.46 %

College/non-university certificate

22.47 %

University Degree

6.28 %

Commuter

Travel To Work

By Car

90.88 %

By Public Transit

0.0 %

By Walking

0.0 %

By Bicycle

0.0 %

By Other Methods

9.12 %

Cultural Diversity

Knowledge of Official Language

Mother Tongue

Building Information

Building Type

Apartments (Low and High Rise)

9.41 %

Houses

90.59 %

Own Vs. Rent