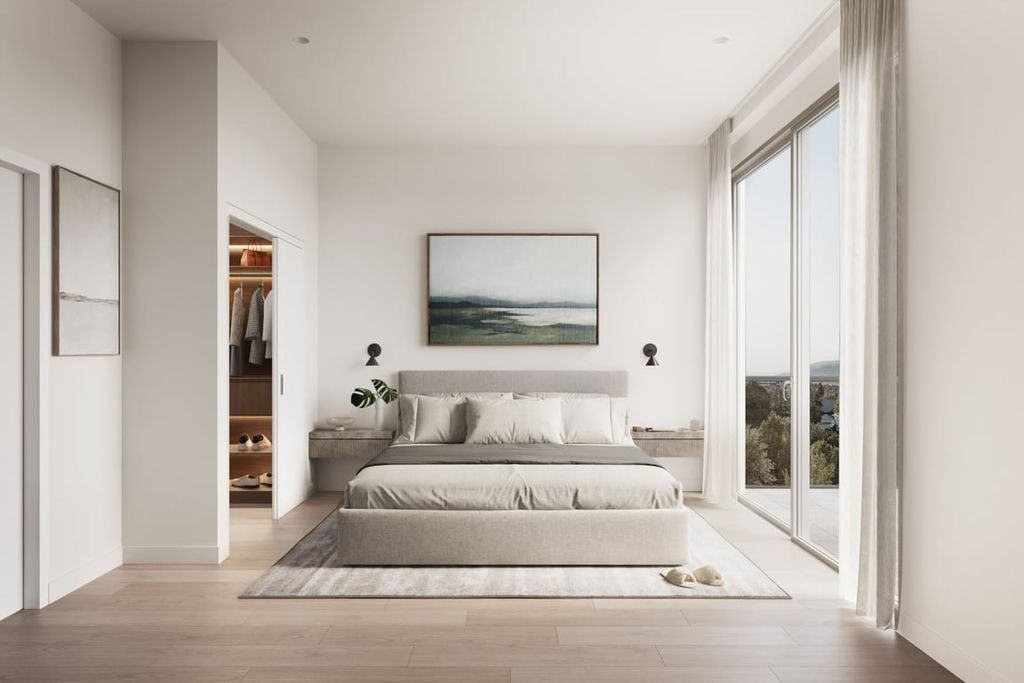
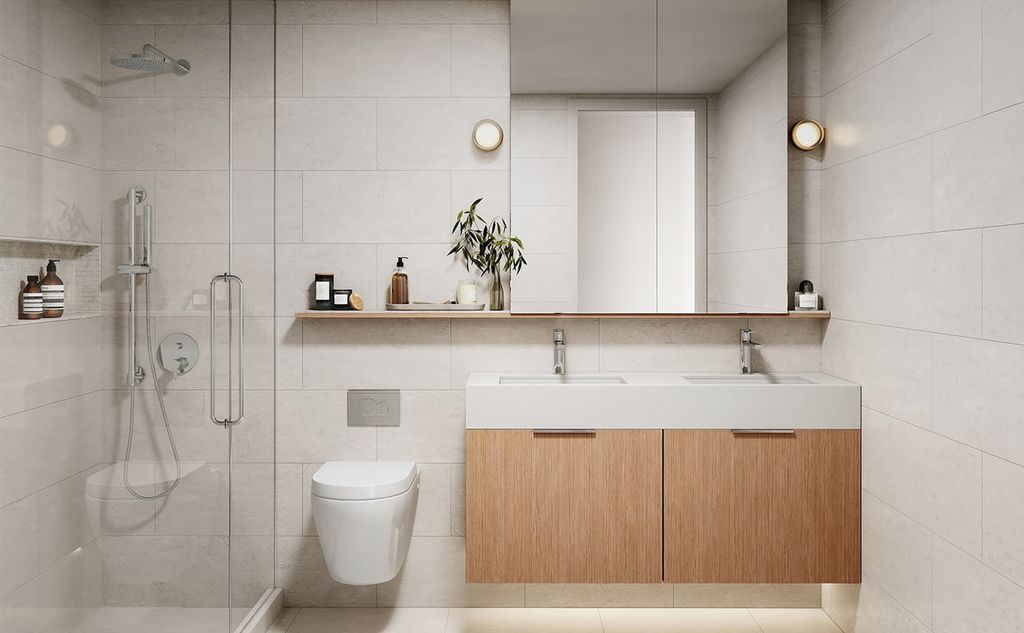
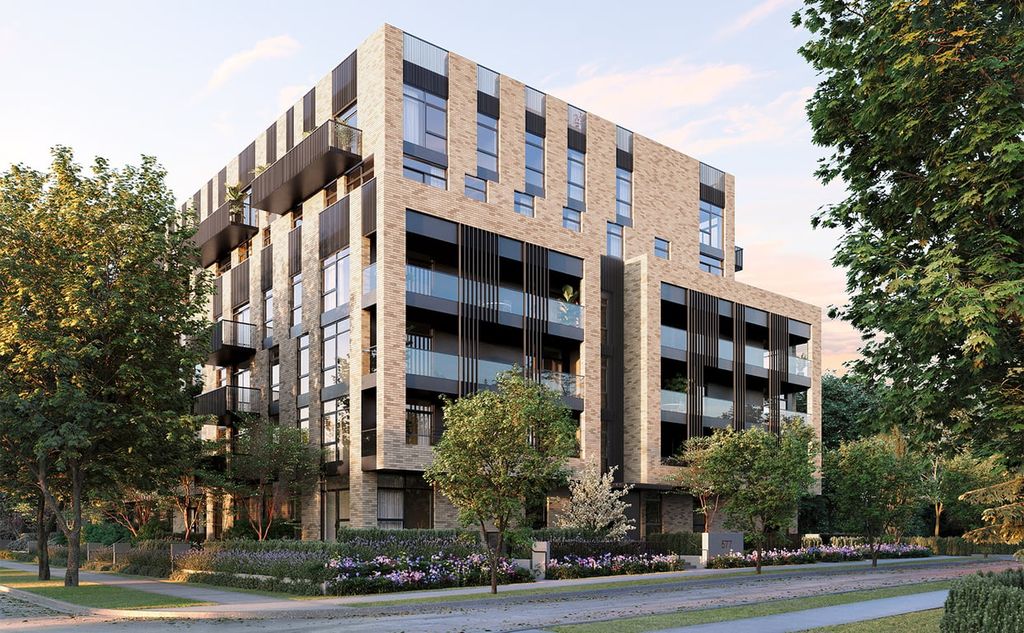
Ashleigh Oakridge - 5010 Ash St - b11_berkeley - Vancouver, BC, V5Z 3G4
2.5 Beds
2 Baths
883 sqft
2.5 Beds
2 Baths
883 sqft
MULTIMEDIA
Mortgage | |
---|---|
Purchase Price | $ |
Down Payment % | $311,225 |
Mortgage Amount | $933,675 |
Mortgage Payment % | $4,844 |
Income | |
---|---|
Gross Rental Income | $ |
Vacancy Rate % | $ |
Other | $ |
Gross Operating Income | $2,569 |
Operating Expenses | |
Management Fees % | $ |
Property Tax | $ |
Repair Reserve % | $ |
Insurance | $ |
Condo/Strata Fees | $ |
Total Operating Expenses | $1,088 |
Net Operating Income | $1,481 |
Debt Service | |
Mortgage Payment | $4,844 |
Net Cash Flow | -$3,362 |
Year 1 | Year 2 | Year 3 | Year 4 | Year 5 | Year 6 | Year 7 | Year 8 | Year 9 | Year 10 | |
---|---|---|---|---|---|---|---|---|---|---|
Investments | ||||||||||
Deposits | $186,735 | $124,490 | - | - | - | - | - | - | - | - |
Closing Costs | - | - | $39,398 | - | - | - | - | - | - | - |
Mortgage Paydown | - | - | $4,766 | $14,756 | $15,465 | $16,208 | $16,987 | $17,804 | $18,659 | $19,556 |
Total | $186,735 | $124,490 | $44,164 | $14,756 | $15,465 | $16,208 | $16,987 | $17,804 | $18,659 | $19,556 |
Cash Invested | $186,735 | $311,225 | $355,389 | $370,145 | $385,611 | $401,819 | $418,807 | $436,611 | $455,271 | $474,828 |
Rental Cash Flows | ||||||||||
Rent and other income | - | - | $10,278 | $31,276 | $32,621 | $34,023 | $35,486 | $37,012 | $38,604 | $40,264 |
Operating Expenses | - | - | -$4,352 | -$13,165 | -$13,495 | -$13,835 | -$14,184 | -$14,543 | -$14,913 | -$15,294 |
Mortgage Payment | - | - | -$19,377 | -$58,133 | -$58,133 | -$58,133 | -$58,133 | -$58,133 | -$58,133 | -$58,133 |
Net Cash Flow | - | - | -$13,451 | -$40,022 | -$39,007 | -$37,944 | -$36,830 | -$35,664 | -$34,442 | -$33,163 |
Returns | ||||||||||
Property Price Appreciation | $62,245 | $65,357 | $68,625 | $72,056 | $75,659 | $79,442 | $83,414 | $87,584 | $91,964 | $96,562 |
Mortgage Paydown | - | - | $4,766 | $14,756 | $15,465 | $16,208 | $16,987 | $17,804 | $18,659 | $19,556 |
Net Cash Flow | - | - | -$13,451 | -$40,022 | -$39,007 | -$37,944 | -$36,830 | -$35,664 | -$34,442 | -$33,163 |
Total Return | $62,245 | $65,357 | $59,940 | $46,789 | $52,116 | $57,706 | $63,571 | $69,724 | $76,181 | $82,955 |
Cumulative Return | $62,245 | $127,602 | $187,542 | $234,332 | $286,448 | $344,155 | $407,726 | $477,451 | $553,632 | $636,588 |
Investment Metrics | ||||||||||
Cumulative ROI | 33.3% | 41.0% | 52.8% | 63.3% | 74.3% | 85.6% | 97.4% | 109.4% | 121.6% | 134.1% |
Cash On Cash | - | - | -3.8% | -10.8% | -10.1% | -9.4% | -8.8% | -8.2% | -7.6% | -7.0% |
14.6%
Price change (1 year)
56.27%
Price change (5 years)
11.18%
Price change (1 year)
60.98%
Price change (5 years)