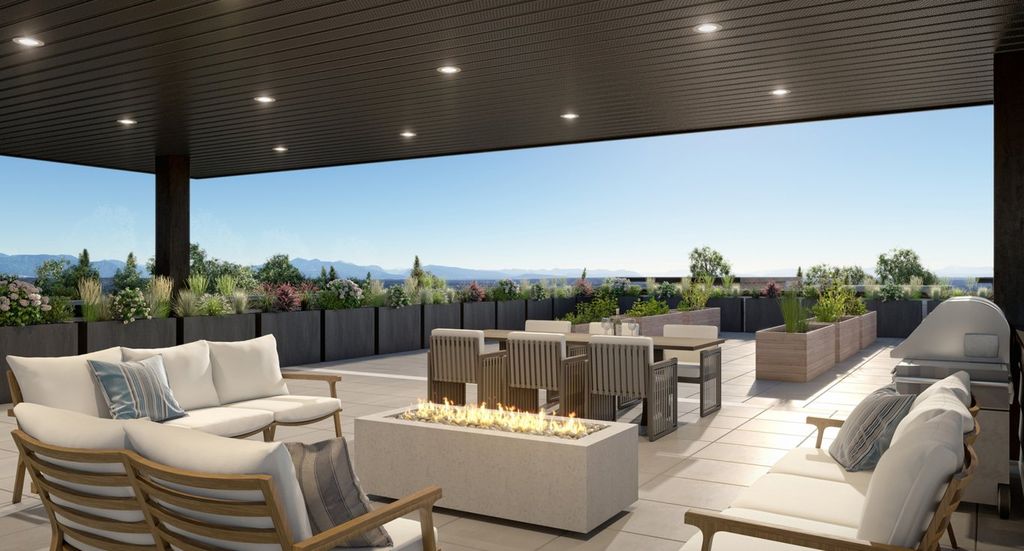
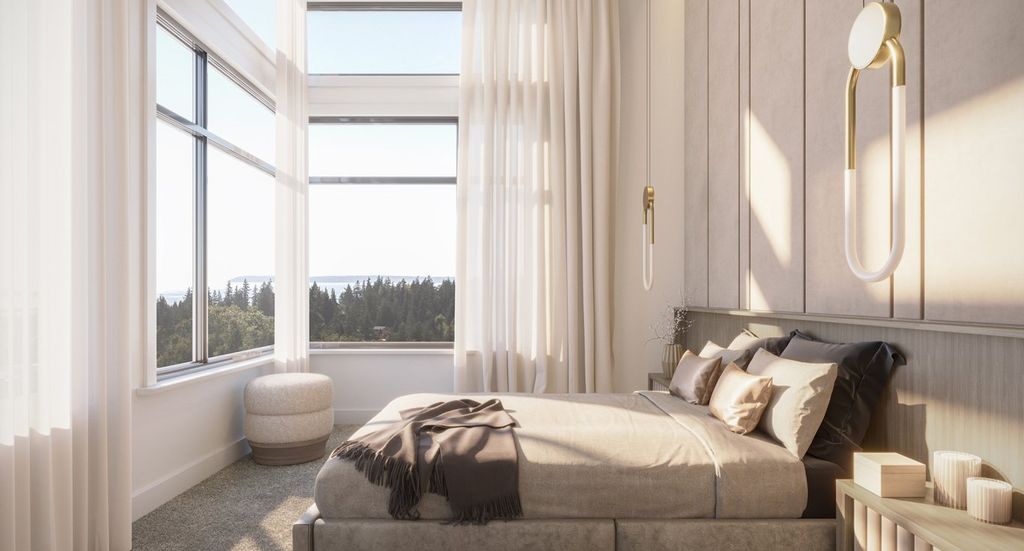
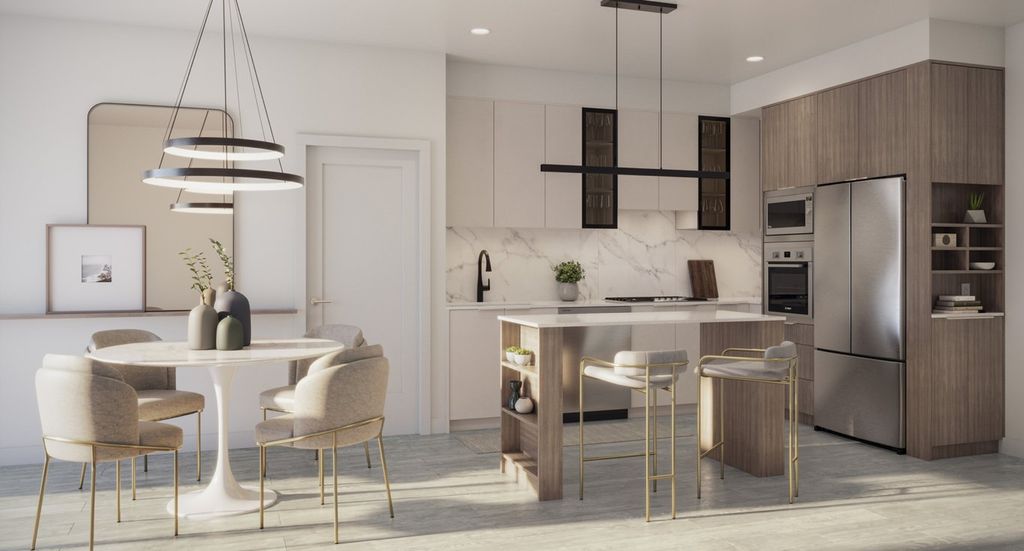
Amson Block - 5937 144 St - d4b_phase_2 - Surrey, BC, V3X 1A6
3.0 Beds
2 Baths
1011 sqft
3.0 Beds
2 Baths
1011 sqft
MULTIMEDIA
Mortgage | |
---|---|
Purchase Price | $ |
Down Payment % | $147,980 |
Mortgage Amount | $591,920 |
Mortgage Payment % | $3,071 |
Income | |
---|---|
Gross Rental Income | $ |
Vacancy Rate % | $ |
Other | $ |
Gross Operating Income | $2,942 |
Operating Expenses | |
Management Fees % | $ |
Property Tax | $ |
Repair Reserve % | $ |
Insurance | $ |
Condo/Strata Fees | $ |
Total Operating Expenses | $841 |
Net Operating Income | $2,100 |
Debt Service | |
Mortgage Payment | $3,071 |
Net Cash Flow | -$970 |
Year 1 | Year 2 | Year 3 | Year 4 | Year 5 | Year 6 | Year 7 | Year 8 | Year 9 | Year 10 | |
---|---|---|---|---|---|---|---|---|---|---|
Investments | ||||||||||
Deposits | $73,990 | - | - | - | - | - | - | - | - | - |
Closing Costs | - | $103,288 | - | - | - | - | - | - | - | - |
Mortgage Paydown | - | $2,262 | $9,318 | $9,766 | $10,235 | $10,727 | $11,243 | $11,783 | $12,349 | $12,943 |
Total | $73,990 | $105,550 | $9,318 | $9,766 | $10,235 | $10,727 | $11,243 | $11,783 | $12,349 | $12,943 |
Cash Invested | $73,990 | $179,540 | $188,858 | $198,624 | $208,860 | $219,587 | $230,831 | $242,614 | $254,964 | $267,908 |
Rental Cash Flows | ||||||||||
Rent and other income | - | $8,826 | $35,683 | $37,218 | $38,818 | $40,487 | $42,228 | $44,044 | $45,938 | $47,913 |
Operating Expenses | - | -$2,523 | -$10,163 | -$10,442 | -$10,730 | -$11,028 | -$11,335 | -$11,652 | -$11,979 | -$12,316 |
Mortgage Payment | - | -$9,213 | -$36,854 | -$36,854 | -$36,854 | -$36,854 | -$36,854 | -$36,854 | -$36,854 | -$36,854 |
Net Cash Flow | - | -$2,911 | -$11,334 | -$10,079 | -$8,767 | -$7,395 | -$5,961 | -$4,462 | -$2,895 | -$1,257 |
Returns | ||||||||||
Property Price Appreciation | $36,995 | $38,844 | $40,786 | $42,826 | $44,967 | $47,216 | $49,576 | $52,055 | $54,658 | $57,391 |
Mortgage Paydown | - | $2,262 | $9,318 | $9,766 | $10,235 | $10,727 | $11,243 | $11,783 | $12,349 | $12,943 |
Net Cash Flow | - | -$2,911 | -$11,334 | -$10,079 | -$8,767 | -$7,395 | -$5,961 | -$4,462 | -$2,895 | -$1,257 |
Total Return | $36,995 | $38,195 | $38,771 | $42,513 | $46,436 | $50,548 | $54,858 | $59,376 | $64,112 | $69,077 |
Cumulative Return | $36,995 | $75,190 | $113,961 | $156,475 | $202,911 | $253,459 | $308,318 | $367,695 | $431,808 | $500,885 |
Investment Metrics | ||||||||||
Cumulative ROI | 50.0% | 41.9% | 60.3% | 78.8% | 97.2% | 115.4% | 133.6% | 151.6% | 169.4% | 187.0% |
Cash On Cash | - | -1.6% | -6.0% | -5.1% | -4.2% | -3.4% | -2.6% | -1.8% | -1.1% | -0.5% |