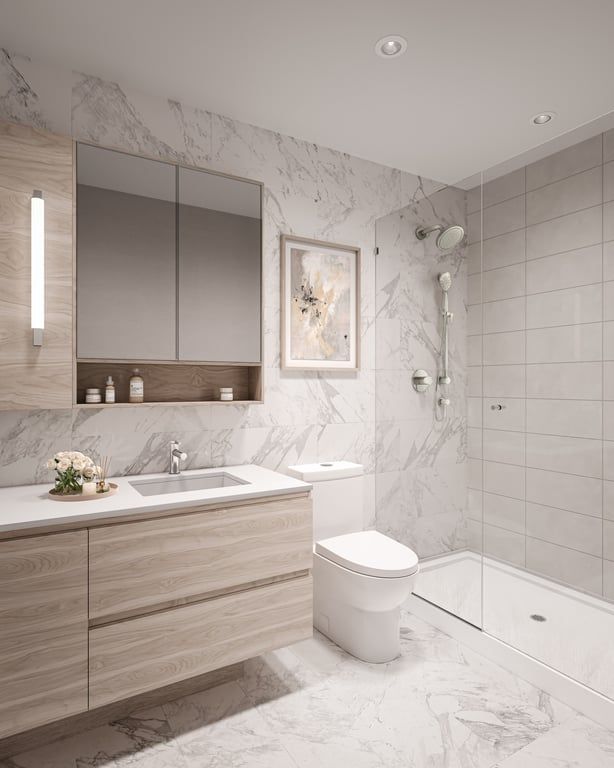
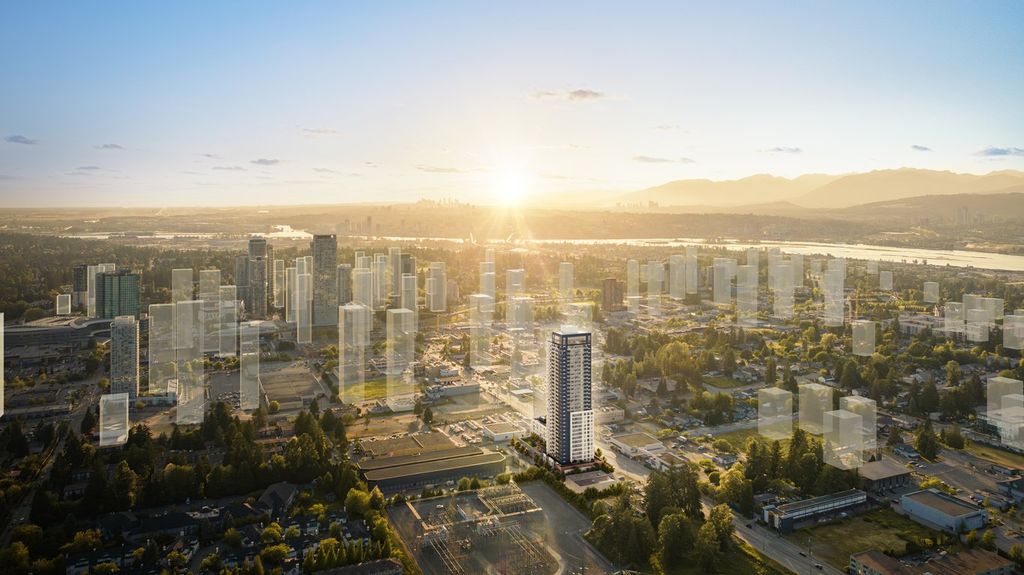
Juno - 13882 104 Ave - b2b_b2c - Surrey, BC, V3T 1W9
1.0 Beds
1 Bath
707 sqft
1.0 Beds
1 Bath
707 sqft
MULTIMEDIA
Mortgage | |
---|---|
Purchase Price | $ |
Down Payment % | $100,000 |
Mortgage Amount | $400,000 |
Mortgage Payment % | $2,075 |
Income | |
---|---|
Gross Rental Income | $ |
Vacancy Rate % | $ |
Other | $ |
Gross Operating Income | $1,378 |
Operating Expenses | |
Management Fees % | $ |
Property Tax | $ |
Repair Reserve % | $ |
Insurance | $ |
Condo/Strata Fees | $ |
Total Operating Expenses | $669 |
Net Operating Income | $709 |
Debt Service | |
Mortgage Payment | $2,075 |
Net Cash Flow | -$1,366 |
Year 1 | Year 2 | Year 3 | Year 4 | Year 5 | Year 6 | Year 7 | Year 8 | Year 9 | Year 10 | |
---|---|---|---|---|---|---|---|---|---|---|
Investments | ||||||||||
Deposits | $50,000 | - | - | - | - | - | - | - | - | - |
Closing Costs | - | - | - | $74,500 | - | - | - | - | - | - |
Mortgage Paydown | - | - | - | $5,165 | $6,471 | $6,782 | $7,108 | $7,450 | $7,808 | $8,184 |
Total | $50,000 | $0 | $0 | $79,665 | $6,471 | $6,782 | $7,108 | $7,450 | $7,808 | $8,184 |
Cash Invested | $50,000 | $50,000 | $50,000 | $129,665 | $136,137 | $142,920 | $150,029 | $157,480 | $165,288 | $173,473 |
Rental Cash Flows | ||||||||||
Rent and other income | - | - | - | $13,786 | $17,136 | $17,873 | $18,642 | $19,443 | $20,279 | $21,151 |
Operating Expenses | - | - | - | -$6,693 | -$8,195 | -$8,396 | -$8,601 | -$8,813 | -$9,031 | -$9,254 |
Mortgage Payment | - | - | - | -$20,754 | -$24,905 | -$24,905 | -$24,905 | -$24,905 | -$24,905 | -$24,905 |
Net Cash Flow | - | - | - | -$13,661 | -$15,964 | -$15,427 | -$14,865 | -$14,275 | -$13,656 | -$13,008 |
Returns | ||||||||||
Property Price Appreciation | $25,000 | $26,249 | $27,562 | $28,940 | $30,387 | $31,907 | $33,502 | $35,177 | $36,936 | $38,783 |
Mortgage Paydown | - | - | - | $5,165 | $6,471 | $6,782 | $7,108 | $7,450 | $7,808 | $8,184 |
Net Cash Flow | - | - | - | -$13,661 | -$15,964 | -$15,427 | -$14,865 | -$14,275 | -$13,656 | -$13,008 |
Total Return | $25,000 | $26,249 | $27,562 | $20,444 | $20,895 | $23,262 | $25,746 | $28,353 | $31,088 | $33,959 |
Cumulative Return | $25,000 | $51,250 | $78,812 | $99,257 | $120,152 | $143,414 | $169,160 | $197,513 | $228,602 | $262,561 |
Investment Metrics | ||||||||||
Cumulative ROI | 50.0% | 102.5% | 157.6% | 76.5% | 88.3% | 100.3% | 112.8% | 125.4% | 138.3% | 151.4% |
Cash On Cash | - | - | - | -10.5% | -11.7% | -10.8% | -9.9% | -9.1% | -8.3% | -7.5% |
-5.95%
Price change (1 year)
28.63%
Price change (5 years)
-4.61%
Price change (1 year)
38.05%
Price change (5 years)