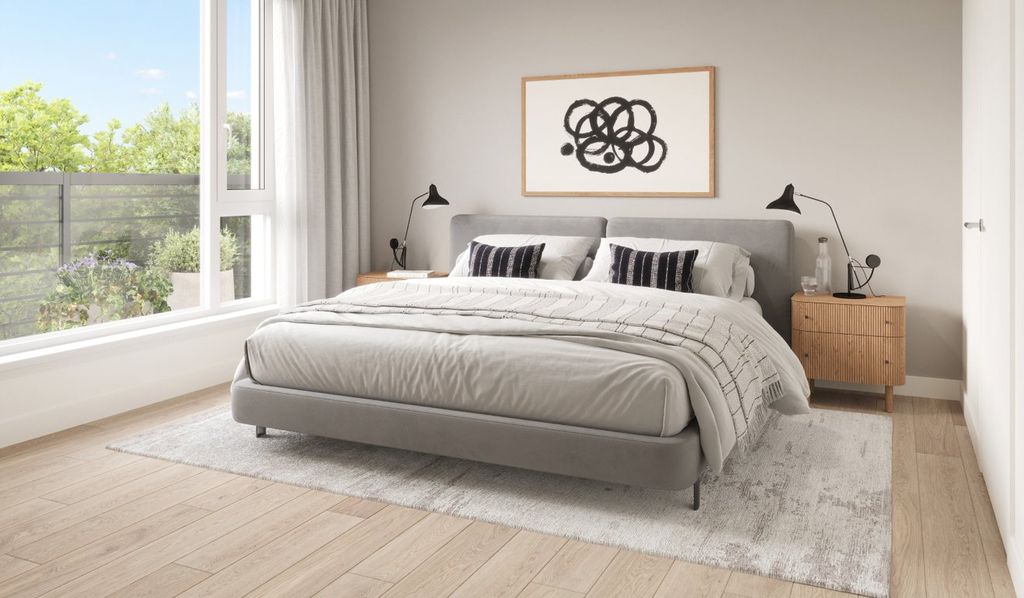
Marlow - 2433 Shaughnessy St - j2 - Port Coquitlam, BC, V3C 3E6
1.0 Beds
1 Bath
757 sqft
1.0 Beds
1 Bath
757 sqft
MULTIMEDIA
Mortgage | |
---|---|
Purchase Price | $ |
Down Payment % | $96,980 |
Mortgage Amount | $387,920 |
Mortgage Payment % | $2,012 |
Income | |
---|---|
Gross Rental Income | $ |
Vacancy Rate % | $ |
Other | $ |
Gross Operating Income | $1,476 |
Operating Expenses | |
Management Fees % | $ |
Property Tax | $ |
Repair Reserve % | $ |
Insurance | $ |
Condo/Strata Fees | $ |
Total Operating Expenses | $597 |
Net Operating Income | $878 |
Debt Service | |
Mortgage Payment | $2,012 |
Net Cash Flow | -$1,134 |
Year 1 | Year 2 | Year 3 | Year 4 | Year 5 | Year 6 | Year 7 | Year 8 | Year 9 | Year 10 | |
---|---|---|---|---|---|---|---|---|---|---|
Investments | ||||||||||
Deposits | $72,735 | - | - | - | - | - | - | - | - | - |
Closing Costs | $48,443 | - | - | - | - | - | - | - | - | - |
Mortgage Paydown | $1,980 | $6,130 | $6,425 | $6,734 | $7,057 | $7,397 | $7,752 | $8,125 | $8,515 | $8,925 |
Total | $123,158 | $6,130 | $6,425 | $6,734 | $7,057 | $7,397 | $7,752 | $8,125 | $8,515 | $8,925 |
Cash Invested | $123,158 | $129,289 | $135,714 | $142,449 | $149,507 | $156,904 | $164,657 | $172,782 | $181,298 | $190,223 |
Rental Cash Flows | ||||||||||
Rent and other income | $5,904 | $17,967 | $18,740 | $19,546 | $20,386 | $21,263 | $22,177 | $23,131 | $24,125 | $25,163 |
Operating Expenses | -$2,391 | -$7,235 | -$7,418 | -$7,606 | -$7,799 | -$7,999 | -$8,204 | -$8,415 | -$8,632 | -$8,856 |
Mortgage Payment | -$8,051 | -$24,153 | -$24,153 | -$24,153 | -$24,153 | -$24,153 | -$24,153 | -$24,153 | -$24,153 | -$24,153 |
Net Cash Flow | -$4,538 | -$13,420 | -$12,830 | -$12,213 | -$11,566 | -$10,888 | -$10,179 | -$9,437 | -$8,660 | -$7,846 |
Returns | ||||||||||
Property Price Appreciation | $24,245 | $25,457 | $26,730 | $28,066 | $29,469 | $30,943 | $32,490 | $34,115 | $35,820 | $37,611 |
Mortgage Paydown | $1,980 | $6,130 | $6,425 | $6,734 | $7,057 | $7,397 | $7,752 | $8,125 | $8,515 | $8,925 |
Net Cash Flow | -$4,538 | -$13,420 | -$12,830 | -$12,213 | -$11,566 | -$10,888 | -$10,179 | -$9,437 | -$8,660 | -$7,846 |
Total Return | $21,687 | $18,167 | $20,324 | $22,587 | $24,961 | $27,451 | $30,063 | $32,803 | $35,676 | $38,690 |
Cumulative Return | $21,687 | $39,854 | $60,179 | $82,767 | $107,729 | $135,180 | $165,244 | $198,047 | $233,724 | $272,415 |
Investment Metrics | ||||||||||
Cumulative ROI | 17.6% | 30.8% | 44.3% | 58.1% | 72.1% | 86.2% | 100.4% | 114.6% | 128.9% | 143.2% |
Cash On Cash | -3.7% | -10.4% | -9.5% | -8.6% | -7.7% | -6.9% | -6.2% | -5.5% | -4.8% | -4.1% |
0.44%
Price change (1 year)
38.15%
Price change (5 years)
-0.02%
Price change (1 year)
48.83%
Price change (5 years)