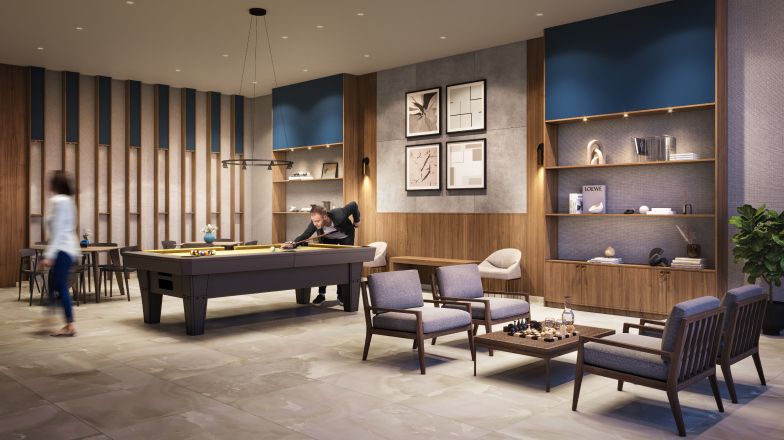
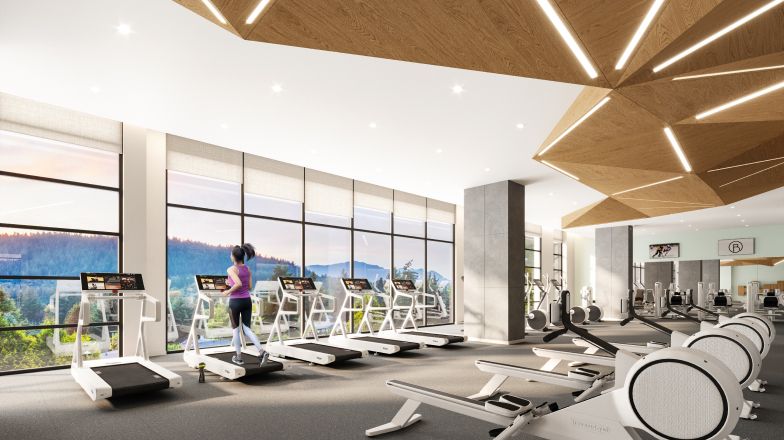
Burquitlam Park District - 602 Clarke Rd - c1a - Coquitlam, BC, V3J 3X6
1.5 Beds
1 Bath
647 sqft
1.5 Beds
1 Bath
647 sqft
MULTIMEDIA
Mortgage | |
---|---|
Purchase Price | $ |
Down Payment % | $120,000 |
Mortgage Amount | $480,000 |
Mortgage Payment % | $2,490 |
Income | |
---|---|
Gross Rental Income | $ |
Vacancy Rate % | $ |
Other | $ |
Gross Operating Income | $1,882 |
Operating Expenses | |
Management Fees % | $ |
Property Tax | $ |
Repair Reserve % | $ |
Insurance | $ |
Condo/Strata Fees | $ |
Total Operating Expenses | $706 |
Net Operating Income | $1,176 |
Debt Service | |
Mortgage Payment | $2,490 |
Net Cash Flow | -$1,314 |
Year 1 | Year 2 | Year 3 | Year 4 | Year 5 | Year 6 | Year 7 | Year 8 | Year 9 | Year 10 | |
---|---|---|---|---|---|---|---|---|---|---|
Investments | ||||||||||
Deposits | $60,000 | $30,000 | - | - | - | - | - | - | - | - |
Closing Costs | - | - | - | $56,500 | - | - | - | - | - | - |
Mortgage Paydown | - | - | - | $6,199 | $7,766 | $8,139 | $8,530 | $8,940 | $9,370 | $9,820 |
Total | $60,000 | $30,000 | $0 | $62,699 | $7,766 | $8,139 | $8,530 | $8,940 | $9,370 | $9,820 |
Cash Invested | $60,000 | $90,000 | $90,000 | $152,699 | $160,465 | $168,604 | $177,135 | $186,076 | $195,446 | $205,267 |
Rental Cash Flows | ||||||||||
Rent and other income | - | - | - | $18,827 | $23,402 | $24,409 | $25,458 | $26,553 | $27,695 | $28,886 |
Operating Expenses | - | - | - | -$7,064 | -$8,658 | -$8,881 | -$9,111 | -$9,347 | -$9,591 | -$9,842 |
Mortgage Payment | - | - | - | -$24,905 | -$29,886 | -$29,886 | -$29,886 | -$29,886 | -$29,886 | -$29,886 |
Net Cash Flow | - | - | - | -$13,141 | -$15,141 | -$14,358 | -$13,538 | -$12,680 | -$11,782 | -$10,842 |
Returns | ||||||||||
Property Price Appreciation | $30,000 | $31,499 | $33,075 | $34,728 | $36,465 | $38,288 | $40,202 | $42,213 | $44,323 | $46,539 |
Mortgage Paydown | - | - | - | $6,199 | $7,766 | $8,139 | $8,530 | $8,940 | $9,370 | $9,820 |
Net Cash Flow | - | - | - | -$13,141 | -$15,141 | -$14,358 | -$13,538 | -$12,680 | -$11,782 | -$10,842 |
Total Return | $30,000 | $31,499 | $33,075 | $27,786 | $29,089 | $32,069 | $35,194 | $38,473 | $41,911 | $45,518 |
Cumulative Return | $30,000 | $61,500 | $94,575 | $122,361 | $151,450 | $183,519 | $218,714 | $257,187 | $299,099 | $344,617 |
Investment Metrics | ||||||||||
Cumulative ROI | 50.0% | 68.3% | 105.1% | 80.1% | 94.4% | 108.8% | 123.5% | 138.2% | 153.0% | 167.9% |
Cash On Cash | - | - | - | -8.6% | -9.4% | -8.5% | -7.6% | -6.8% | -6.0% | -5.3% |
3.66%
Price change (1 year)
37.36%
Price change (5 years)
-1.69%
Price change (1 year)
44.64%
Price change (5 years)