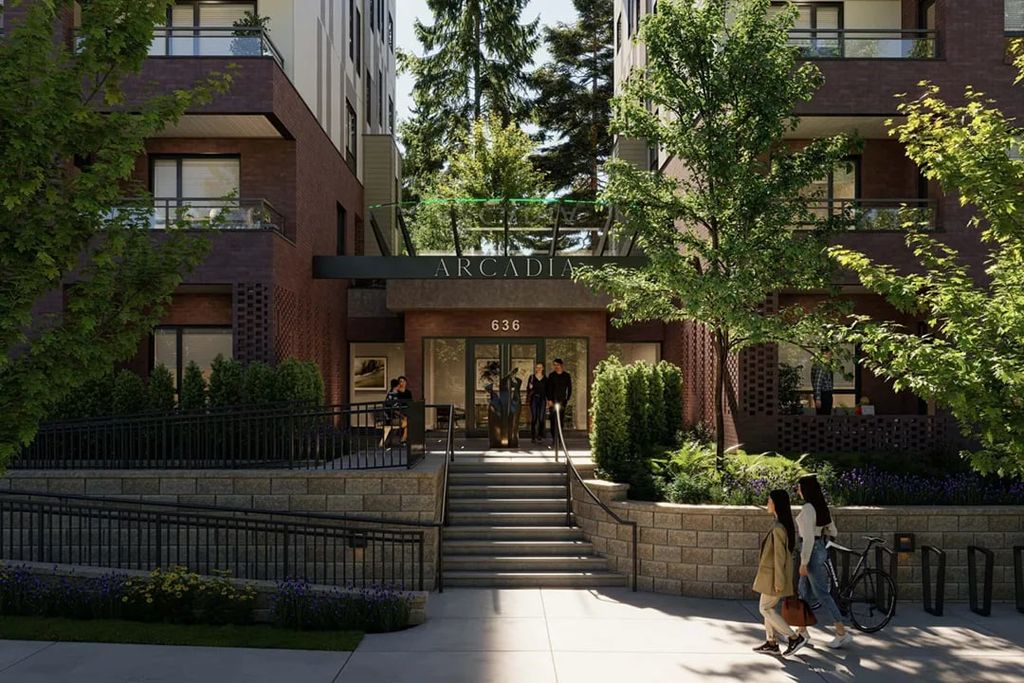
Arcadia - 644 Tyndall St - c - Coquitlam, BC, V3J 3S8
1.5 Beds
1 Bath
575 sqft
1.5 Beds
1 Bath
575 sqft
MULTIMEDIA
Mortgage | |
---|---|
Purchase Price | $ |
Down Payment % | $126,580 |
Mortgage Amount | $506,320 |
Mortgage Payment % | $2,627 |
Income | |
---|---|
Gross Rental Income | $ |
Vacancy Rate % | $ |
Other | $ |
Gross Operating Income | $1,673 |
Operating Expenses | |
Management Fees % | $ |
Property Tax | $ |
Repair Reserve % | $ |
Insurance | $ |
Condo/Strata Fees | $ |
Total Operating Expenses | $623 |
Net Operating Income | $1,049 |
Debt Service | |
Mortgage Payment | $2,627 |
Net Cash Flow | -$1,577 |
Year 1 | Year 2 | Year 3 | Year 4 | Year 5 | Year 6 | Year 7 | Year 8 | Year 9 | Year 10 | |
---|---|---|---|---|---|---|---|---|---|---|
Investments | ||||||||||
Deposits | $63,290 | - | - | - | - | - | - | - | - | - |
Closing Costs | - | $90,448 | - | - | - | - | - | - | - | - |
Mortgage Paydown | - | $6,539 | $8,192 | $8,585 | $8,998 | $9,431 | $9,884 | $10,359 | $10,857 | $11,379 |
Total | $63,290 | $96,987 | $8,192 | $8,585 | $8,998 | $9,431 | $9,884 | $10,359 | $10,857 | $11,379 |
Cash Invested | $63,290 | $160,277 | $168,469 | $177,054 | $186,053 | $195,484 | $205,368 | $215,728 | $226,585 | $237,964 |
Rental Cash Flows | ||||||||||
Rent and other income | - | $16,732 | $20,798 | $21,692 | $22,625 | $23,598 | $24,613 | $25,671 | $26,775 | $27,926 |
Operating Expenses | - | -$6,237 | -$7,645 | -$7,842 | -$8,045 | -$8,255 | -$8,470 | -$8,692 | -$8,921 | -$9,156 |
Mortgage Payment | - | -$26,270 | -$31,524 | -$31,524 | -$31,524 | -$31,524 | -$31,524 | -$31,524 | -$31,524 | -$31,524 |
Net Cash Flow | - | -$15,775 | -$18,371 | -$17,674 | -$16,945 | -$16,181 | -$15,382 | -$14,545 | -$13,670 | -$12,754 |
Returns | ||||||||||
Property Price Appreciation | $31,645 | $33,227 | $34,888 | $36,633 | $38,464 | $40,387 | $42,407 | $44,527 | $46,754 | $49,091 |
Mortgage Paydown | - | $6,539 | $8,192 | $8,585 | $8,998 | $9,431 | $9,884 | $10,359 | $10,857 | $11,379 |
Net Cash Flow | - | -$15,775 | -$18,371 | -$17,674 | -$16,945 | -$16,181 | -$15,382 | -$14,545 | -$13,670 | -$12,754 |
Total Return | $31,645 | $23,990 | $24,708 | $27,543 | $30,517 | $33,637 | $36,909 | $40,341 | $43,940 | $47,716 |
Cumulative Return | $31,645 | $55,635 | $80,344 | $107,888 | $138,406 | $172,043 | $208,952 | $249,294 | $293,234 | $340,951 |
Investment Metrics | ||||||||||
Cumulative ROI | 50.0% | 34.7% | 47.7% | 60.9% | 74.4% | 88.0% | 101.7% | 115.6% | 129.4% | 143.3% |
Cash On Cash | - | -9.8% | -10.9% | -10.0% | -9.1% | -8.3% | -7.5% | -6.7% | -6.0% | -5.4% |
-2.17%
Price change (1 year)
41.51%
Price change (5 years)