


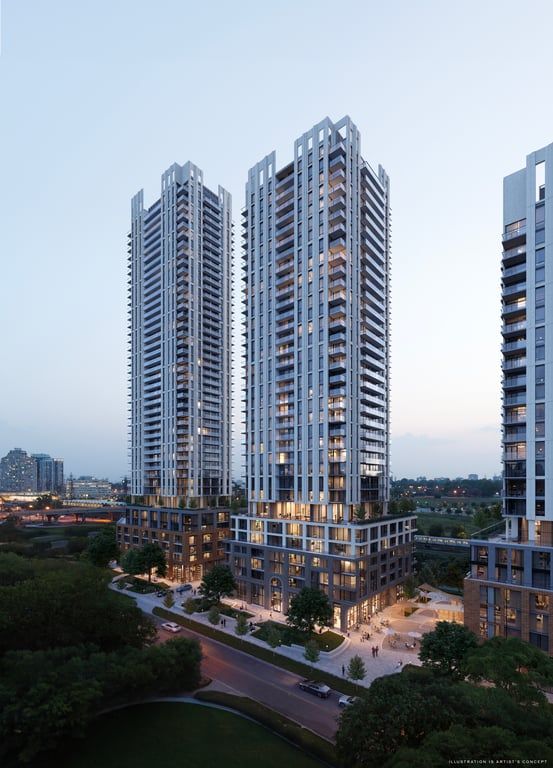


c0304_eagle_tower-56 Fieldway Rd, Toronto, ON, M8Z 3L2
Toronto ON, M8Z 3L2
MLS® # PB1126-C0304_EAGLE_TOWER


2 Beds
1 Bath
556 sqft
Toronto ON, M8Z 3L2
| Mortgage | |
|---|---|
| Purchase Price | $ |
| Down Payment % | $131,997 |
| Mortgage Amount | $527,993 |
| Mortgage Payment % | $2,739 |
| Income | |
|---|---|
| Gross Rental Income | $ |
| Vacancy Rate % | $ |
| Other | $ |
| Gross Operating Income | $1,617 |
| Operating Expenses | |
| Management Fees % | $ |
| Property Tax | $ |
| Repair Reserve % | $ |
| Insurance | $ |
| Condo/Strata Fees | $ |
| Total Operating Expenses | $698 |
| Net Operating Income | $919 |
| Debt Service | |
| Mortgage Payment | $2,739 |
| Net Cash Flow | -$1,820 |
| Year 1 | Year 2 | Year 3 | Year 4 | Year 5 | Year 6 | Year 7 | Year 8 | Year 9 | Year 10 | |
|---|---|---|---|---|---|---|---|---|---|---|
| Investments | ||||||||||
| Deposits | $65,998 | $65,999 | - | - | - | - | - | - | - | - |
| Closing Costs | - | - | $35,849 | - | - | - | - | - | - | - |
| Mortgage Paydown | - | - | $7,515 | $8,576 | $8,988 | $9,420 | $9,873 | $10,347 | $10,845 | $11,366 |
| Total | $65,998 | $65,999 | $43,364 | $8,576 | $8,988 | $9,420 | $9,873 | $10,347 | $10,845 | $11,366 |
| Cash Invested | $65,998 | $131,997 | $175,361 | $183,937 | $192,926 | $202,346 | $212,219 | $222,567 | $233,412 | $244,779 |
| Rental Cash Flows | ||||||||||
| Rent and other income | - | - | $17,797 | $20,180 | $21,048 | $21,953 | $22,897 | $23,882 | $24,909 | $25,980 |
| Operating Expenses | - | - | -$7,686 | -$8,576 | -$8,791 | -$9,012 | -$9,239 | -$9,472 | -$9,713 | -$9,960 |
| Mortgage Payment | - | - | -$30,134 | -$32,874 | -$32,874 | -$32,874 | -$32,874 | -$32,874 | -$32,874 | -$32,874 |
| Net Cash Flow | - | - | -$20,023 | -$21,270 | -$20,617 | -$19,932 | -$19,215 | -$18,464 | -$17,678 | -$16,854 |
| Returns | ||||||||||
| Property Price Appreciation | $32,999 | $34,649 | $36,381 | $38,201 | $40,111 | $42,116 | $44,222 | $46,433 | $48,755 | $51,193 |
| Mortgage Paydown | - | - | $7,515 | $8,576 | $8,988 | $9,420 | $9,873 | $10,347 | $10,845 | $11,366 |
| Net Cash Flow | - | - | -$20,023 | -$21,270 | -$20,617 | -$19,932 | -$19,215 | -$18,464 | -$17,678 | -$16,854 |
| Total Return | $32,999 | $34,649 | $23,873 | $25,506 | $28,482 | $31,604 | $34,879 | $38,316 | $41,921 | $45,704 |
| Cumulative Return | $32,999 | $67,648 | $91,522 | $117,029 | $145,512 | $177,116 | $211,996 | $250,312 | $292,234 | $337,939 |
| Investment Metrics | ||||||||||
| Cumulative ROI | 50.0% | 51.3% | 52.2% | 63.6% | 75.4% | 87.5% | 99.9% | 112.5% | 125.2% | 138.1% |
| Cash On Cash | - | - | -11.4% | -11.6% | -10.7% | -9.9% | -9.1% | -8.3% | -7.6% | -6.9% |
11.04%
Price change (1 year)
62.12%
Price change (5 years)
10.8%
Price change (1 year)
61.84%
Price change (5 years)
