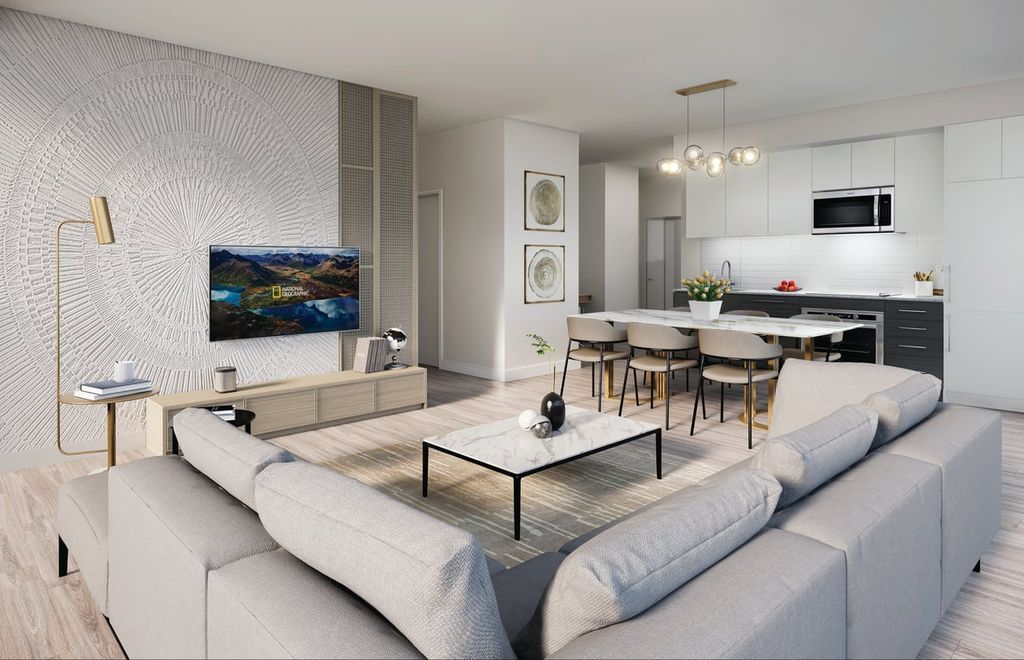
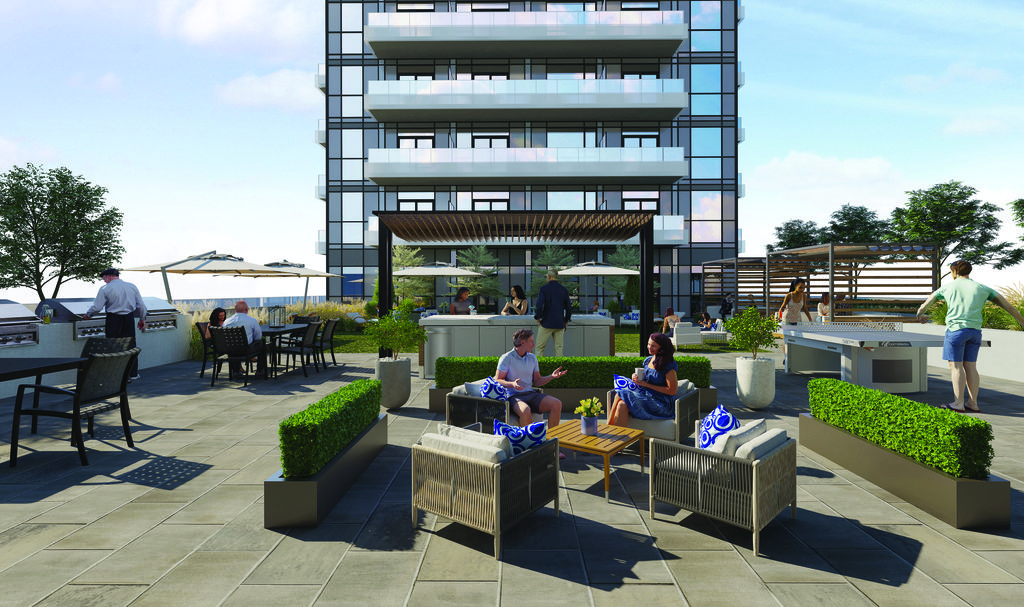
The Highmark - 1640 Kingston Rd - 909b - Pickering, ON, L1V 1C3
1.0 Beds
1 Bath
446 sqft
1.0 Beds
1 Bath
446 sqft
MULTIMEDIA
Mortgage | |
---|---|
Purchase Price | $ |
Down Payment % | $115,798 |
Mortgage Amount | $463,192 |
Mortgage Payment % | $2,403 |
Income | |
---|---|
Gross Rental Income | $ |
Vacancy Rate % | $ |
Other | $ |
Gross Operating Income | $869 |
Operating Expenses | |
Management Fees % | $ |
Property Tax | $ |
Repair Reserve % | $ |
Insurance | $ |
Condo/Strata Fees | $ |
Total Operating Expenses | $487 |
Net Operating Income | $382 |
Debt Service | |
Mortgage Payment | $2,403 |
Net Cash Flow | -$2,021 |
Year 1 | Year 2 | Year 3 | Year 4 | Year 5 | Year 6 | Year 7 | Year 8 | Year 9 | Year 10 | |
---|---|---|---|---|---|---|---|---|---|---|
Investments | ||||||||||
Deposits | $72,371 | $14,474 | $28,949 | - | - | - | - | - | - | - |
Closing Costs | - | - | $24,558 | - | - | - | - | - | - | - |
Mortgage Paydown | - | - | $3,561 | $7,377 | $7,732 | $8,104 | $8,493 | $8,901 | $9,329 | $9,778 |
Total | $72,371 | $14,474 | $57,068 | $7,377 | $7,732 | $8,104 | $8,493 | $8,901 | $9,329 | $9,778 |
Cash Invested | $72,371 | $86,845 | $143,913 | $151,291 | $159,023 | $167,127 | $175,621 | $184,523 | $193,853 | $203,631 |
Rental Cash Flows | ||||||||||
Rent and other income | - | - | $5,218 | $10,660 | $11,119 | $11,597 | $12,096 | $12,616 | $13,158 | $13,724 |
Operating Expenses | - | - | -$2,924 | -$5,918 | -$6,059 | -$6,204 | -$6,353 | -$6,505 | -$6,662 | -$6,823 |
Mortgage Payment | - | - | -$14,419 | -$28,839 | -$28,839 | -$28,839 | -$28,839 | -$28,839 | -$28,839 | -$28,839 |
Net Cash Flow | - | - | -$12,126 | -$24,097 | -$23,780 | -$23,446 | -$23,096 | -$22,729 | -$22,343 | -$21,939 |
Returns | ||||||||||
Property Price Appreciation | $28,949 | $30,396 | $31,916 | $33,512 | $35,188 | $36,947 | $38,795 | $40,734 | $42,771 | $44,910 |
Mortgage Paydown | - | - | $3,561 | $7,377 | $7,732 | $8,104 | $8,493 | $8,901 | $9,329 | $9,778 |
Net Cash Flow | - | - | -$12,126 | -$24,097 | -$23,780 | -$23,446 | -$23,096 | -$22,729 | -$22,343 | -$21,939 |
Total Return | $28,949 | $30,396 | $23,351 | $16,793 | $19,140 | $21,605 | $24,191 | $26,907 | $29,757 | $32,749 |
Cumulative Return | $28,949 | $59,346 | $82,698 | $99,491 | $118,631 | $140,237 | $164,428 | $191,336 | $221,093 | $253,843 |
Investment Metrics | ||||||||||
Cumulative ROI | 40.0% | 68.3% | 57.5% | 65.8% | 74.6% | 83.9% | 93.6% | 103.7% | 114.1% | 124.7% |
Cash On Cash | - | - | -8.4% | -15.9% | -15.0% | -14.0% | -13.2% | -12.3% | -11.5% | -10.8% |
1.05%
Price change (1 year)
50.75%
Price change (5 years)