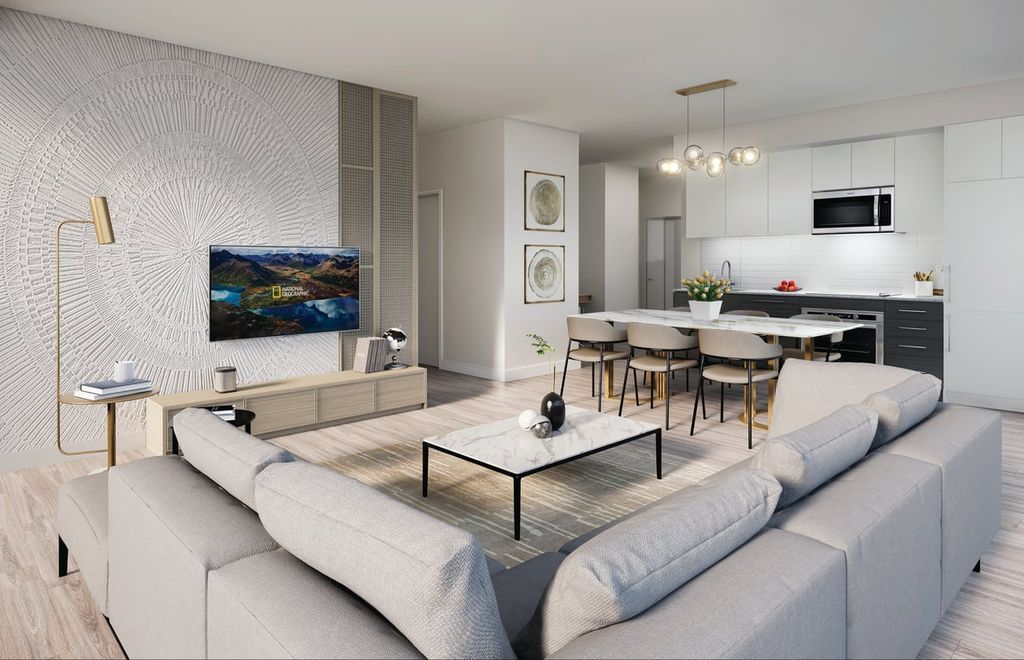
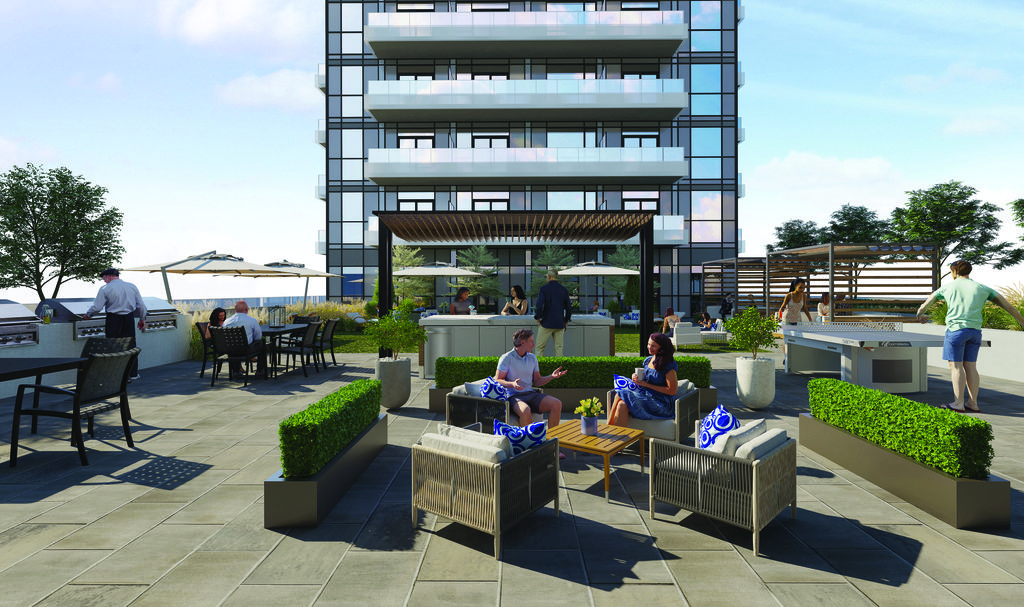
$633,990
2 Beds
1 Bath
559 sqft
Potential Investment Performance
Cumulative ROI
82.1%
Cumulative Market Appreciation
$175,159
Net Operating Income in Year 5
$14,803
Cash on Cash Return in Year 5
-10.5%
Assumptions
The information below is based on user inputs and general assumptions for informational purposes only. The outputs are not legal, financial, investment, or other advice. Review all fields for accuracy and consult an agent for guidance.
Mortgage Calculator
| Mortgage | |
|---|---|
| Purchase Price | $ |
| Down Payment % | $126,798 |
| Mortgage Amount | $507,192 |
| Mortgage Payment % | $2,631 |
Cash Flow Calculator
monthly
yearly
| Income | |
|---|---|
Gross Rental Income | $ |
| Vacancy Rate % | $ |
| Other | $ |
| Gross Operating Income | $1,626 |
| Operating Expenses | |
| Management Fees % | $ |
| Property Tax | $ |
| Repair Reserve % | $ |
| Insurance | $ |
| Condo/Strata Fees | $ |
| Total Operating Expenses | $638 |
| Net Operating Income | $987 |
| Debt Service | |
| Mortgage Payment | $2,631 |
| Net Cash Flow | -$1,643 |
Acquistion Costs
Deposit $126,794
Land Transfer Tax $9,154
Legal Fees $1,500
Adjustments $0
Development Charges $15,000
Down Payment Balance $4
Total Acquisition Costs $152,452
Deposit Schedule
With the Offer $5,000
Deposit @ 30 days $10,849
Deposit @ 90 days $15,849
Deposit @ 180 days $15,849
Deposit @ 365 days $15,849
Deposit @ 0 days $31,699
Due on Occupancy $31,699
Total Deposit $126,794
Closing Date Sep 1, 2027
Components of Return
Potential Returns
| Year 1 | Year 2 | Year 3 | Year 4 | Year 5 | Year 6 | Year 7 | Year 8 | Year 9 | Year 10 | |
|---|---|---|---|---|---|---|---|---|---|---|
| Investments | ||||||||||
| Deposits | $79,246 | $15,849 | $31,699 | - | - | - | - | - | - | - |
| Closing Costs | - | - | $25,658 | - | - | - | - | - | - | - |
| Mortgage Paydown | - | - | $6,550 | $8,206 | $8,600 | $9,013 | $9,447 | $9,901 | $10,377 | $10,875 |
| Total | $79,246 | $15,849 | $63,907 | $8,206 | $8,600 | $9,013 | $9,447 | $9,901 | $10,377 | $10,875 |
| Cash Invested | $79,246 | $95,095 | $159,002 | $167,208 | $175,809 | $184,823 | $194,270 | $204,171 | $214,548 | $225,424 |
| Rental Cash Flows | ||||||||||
| Rent and other income | - | - | $16,266 | $20,219 | $21,089 | $21,996 | $22,941 | $23,928 | $24,957 | $26,030 |
| Operating Expenses | - | - | -$6,387 | -$7,827 | -$8,027 | -$8,232 | -$8,444 | -$8,662 | -$8,886 | -$9,117 |
| Mortgage Payment | - | - | -$26,316 | -$31,579 | -$31,579 | -$31,579 | -$31,579 | -$31,579 | -$31,579 | -$31,579 |
| Net Cash Flow | - | - | -$16,436 | -$19,186 | -$18,517 | -$17,815 | -$17,081 | -$16,312 | -$15,508 | -$14,666 |
| Returns | ||||||||||
| Property Price Appreciation | $31,699 | $33,284 | $34,948 | $36,696 | $38,530 | $40,457 | $42,480 | $44,604 | $46,834 | $49,176 |
| Mortgage Paydown | - | - | $6,550 | $8,206 | $8,600 | $9,013 | $9,447 | $9,901 | $10,377 | $10,875 |
| Net Cash Flow | - | - | -$16,436 | -$19,186 | -$18,517 | -$17,815 | -$17,081 | -$16,312 | -$15,508 | -$14,666 |
| Total Return | $31,699 | $33,284 | $25,062 | $25,715 | $28,614 | $31,655 | $34,845 | $38,192 | $41,703 | $45,386 |
| Cumulative Return | $31,699 | $64,983 | $90,046 | $115,761 | $144,376 | $176,031 | $210,877 | $249,070 | $290,773 | $336,160 |
| Investment Metrics | ||||||||||
| Cumulative ROI | 40.0% | 68.3% | 56.6% | 69.2% | 82.1% | 95.2% | 108.5% | 122.0% | 135.5% | 149.1% |
| Cash On Cash | - | - | -10.3% | -11.5% | -10.5% | -9.6% | -8.8% | -8.0% | -7.2% | -6.5% |
Market Price Trends
All Properties
-3.84%
Price change (1 year)
34.2%
Price change (5 years)


