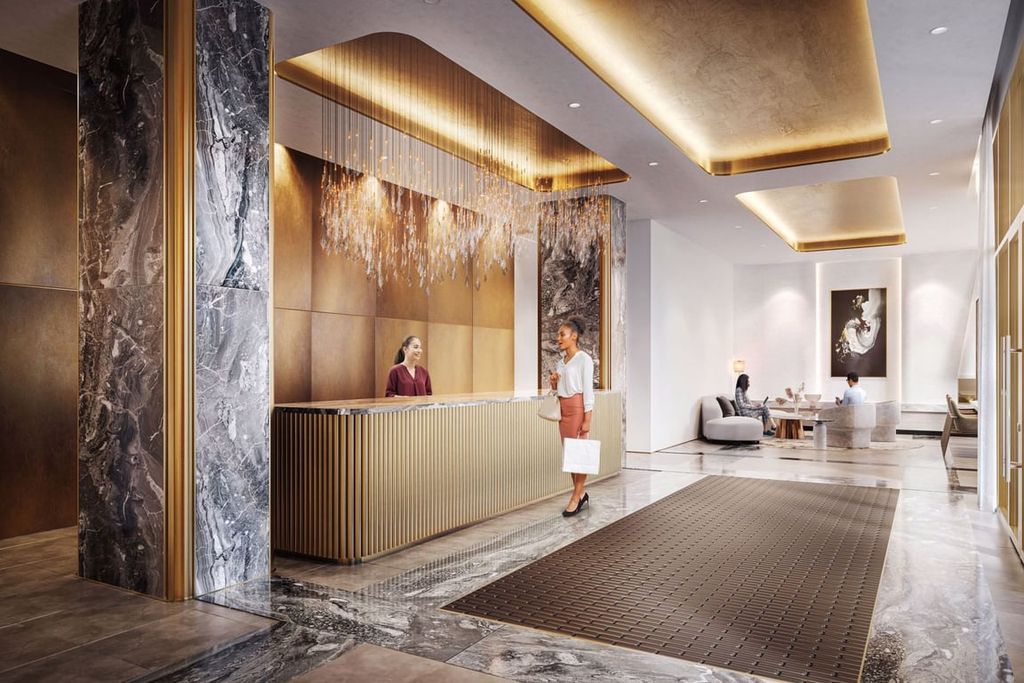
The Grand at Universal City - 1474 Bayly St - 1f_d - Pickering, ON, L1W 1L8
1.5 Beds
2 Baths
686 sqft
1.5 Beds
2 Baths
686 sqft
MULTIMEDIA
Mortgage | |
---|---|
Purchase Price | $ |
Down Payment % | $153,980 |
Mortgage Amount | $615,920 |
Mortgage Payment % | $3,195 |
Income | |
---|---|
Gross Rental Income | $ |
Vacancy Rate % | $ |
Other | $ |
Gross Operating Income | $1,996 |
Operating Expenses | |
Management Fees % | $ |
Property Tax | $ |
Repair Reserve % | $ |
Insurance | $ |
Condo/Strata Fees | $ |
Total Operating Expenses | $836 |
Net Operating Income | $1,159 |
Debt Service | |
Mortgage Payment | $3,195 |
Net Cash Flow | -$2,036 |
Year 1 | Year 2 | Year 3 | Year 4 | Year 5 | Year 6 | Year 7 | Year 8 | Year 9 | Year 10 | |
---|---|---|---|---|---|---|---|---|---|---|
Investments | ||||||||||
Deposits | $96,236 | - | $1,000 | - | - | - | - | - | - | - |
Closing Costs | - | - | $85,117 | - | - | - | - | - | - | - |
Mortgage Paydown | - | - | $3,144 | $9,734 | $10,202 | $10,692 | $11,206 | $11,744 | $12,309 | $12,901 |
Total | $96,236 | $0 | $89,261 | $9,734 | $10,202 | $10,692 | $11,206 | $11,744 | $12,309 | $12,901 |
Cash Invested | $96,236 | $96,236 | $185,497 | $195,231 | $205,433 | $216,126 | $227,332 | $239,077 | $251,386 | $264,287 |
Rental Cash Flows | ||||||||||
Rent and other income | - | - | $7,985 | $24,298 | $25,343 | $26,433 | $27,569 | $28,755 | $29,991 | $31,281 |
Operating Expenses | - | - | -$3,347 | -$10,126 | -$10,380 | -$10,642 | -$10,911 | -$11,188 | -$11,473 | -$11,767 |
Mortgage Payment | - | - | -$12,783 | -$38,349 | -$38,349 | -$38,349 | -$38,349 | -$38,349 | -$38,349 | -$38,349 |
Net Cash Flow | - | - | -$8,145 | -$24,176 | -$23,386 | -$22,558 | -$21,690 | -$20,782 | -$19,830 | -$18,834 |
Returns | ||||||||||
Property Price Appreciation | $38,495 | $40,419 | $42,440 | $44,562 | $46,790 | $49,130 | $51,586 | $54,166 | $56,874 | $59,718 |
Mortgage Paydown | - | - | $3,144 | $9,734 | $10,202 | $10,692 | $11,206 | $11,744 | $12,309 | $12,901 |
Net Cash Flow | - | - | -$8,145 | -$24,176 | -$23,386 | -$22,558 | -$21,690 | -$20,782 | -$19,830 | -$18,834 |
Total Return | $38,495 | $40,419 | $37,439 | $30,120 | $33,606 | $37,264 | $41,102 | $45,129 | $49,353 | $53,784 |
Cumulative Return | $38,495 | $78,914 | $116,354 | $146,475 | $180,081 | $217,346 | $258,449 | $303,578 | $352,931 | $406,716 |
Investment Metrics | ||||||||||
Cumulative ROI | 40.0% | 82.0% | 62.7% | 75.0% | 87.7% | 100.6% | 113.7% | 127.0% | 140.4% | 153.9% |
Cash On Cash | - | - | -4.4% | -12.4% | -11.4% | -10.4% | -9.5% | -8.7% | -7.9% | -7.1% |
1.34%
Price change (1 year)
39.6%
Price change (5 years)